Angular, an open-source web application framework, is a popular choice among web developers. To create flexibility for users to plot network graphs with the provided data, we will demonstrate how to make use of an npm package Highcharts to plot Network Graphs in Angular.
In this blog, we will cover:
- What is Highcharts?
- What is HighChart Angular Wrapper?
- What is Network Graphs?
- Hands-on
- Conclusion
What is Highcharts?
Highcharts is a JavaScript-based charting package that adds interactive charting functionality to web applications. Highcharts has a large number of charts to choose from. Line charts, spline charts, area charts, bar charts, pie charts, and other types of graphs are examples.
To know more, refer to:
How to plot Bar Charts in Angular using npm package Highcharts?
What is HighChart Angular Wrapper?
HighChart Angular Wrapper is an open-source Angular component that provides elegant and feature-rich HighCharts visualizations within an Angular application and can be used alongside Angular components seamlessly.
What is Network Graphs?
Network graphs (force-directed graphs) are mathematical structures (graphs) that visually depict the relationships between points. The graph shows the relationships between the various topics. The relationships between the entities are shown as lines, and the entities are shown as nodes. The other interconnected nodes receive an assigned weighted factor, and the graph is a force directed by applying weight (force) from the node edges. The graph represents the weight as forces acting on the nodes to determine where they should be located on the plotting area of the graph. The Network Graph can be used in a variety of ways, including to display relationships between people, places, businesses, and products.
Hands-on
In this hands-on, we will begin with an online compiler for angular called StackBlitz which gives us the flexibility of an already created folder structure. We will be using this compiler to create flexibility for users to plot network graphs with the provided data. We will first begin with exploring the files created by default and then alter the folder structure as per our need. Providing proper naming conventions for the file, we will create a new HTML file, we will alter the input parameter value, and change the template URL to point to the newly created HTML file for the child component.
We will then install the highcharts and the highchart angular wrapper to be able to plot the network graphs. Post that we will import the highcharts component into the app module file. To test out the configuration of highcharts we will then create a network graph utilizing the various different parameters offered by highcharts and have a look at the different features offered.
Required installations for the process:
- HighChart: It is a JavaScript charting library that is used to enhance web applications by adding different interactive charting capabilities.
- HighChart Angular: It is an Angular wrapper that provides rich Highcharts visualizations within an application in the different components.
To perform the hands-on on a local machine, you can follow the steps mentioned in the below link of the original angular documentation to create a new project and then follow the hands-on steps shown below.
https://angular.io/tutorial/toh-pt0
To follow the steps we performed, you can navigate to the link below. The link below is an online compiler for angular and can be used to code logics, test out features, create simple applications, and much more.
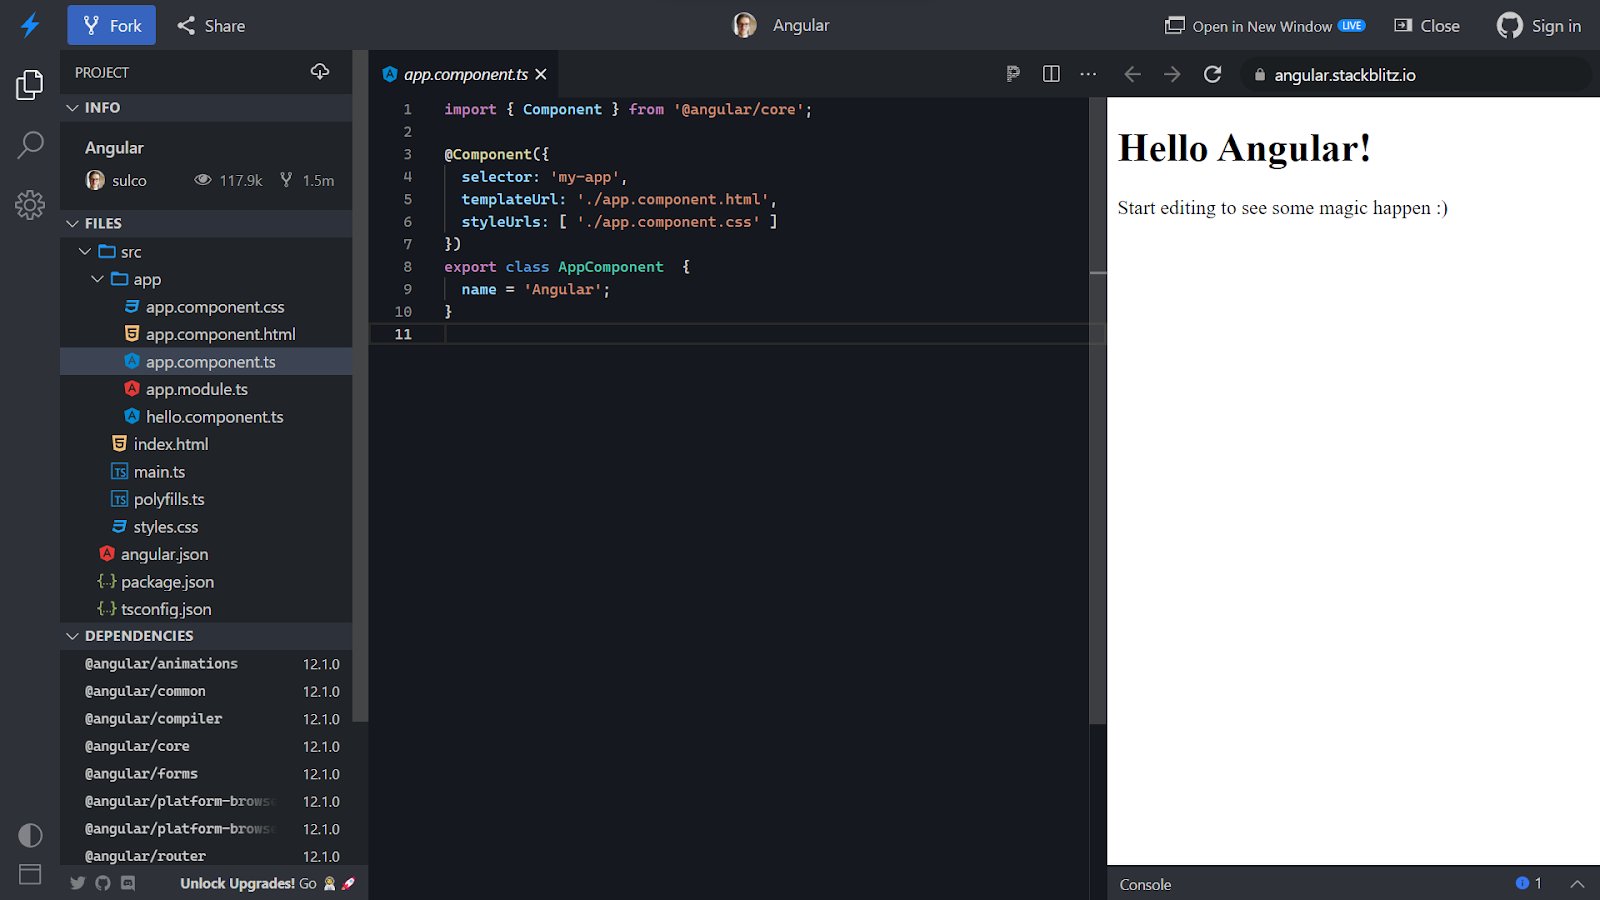
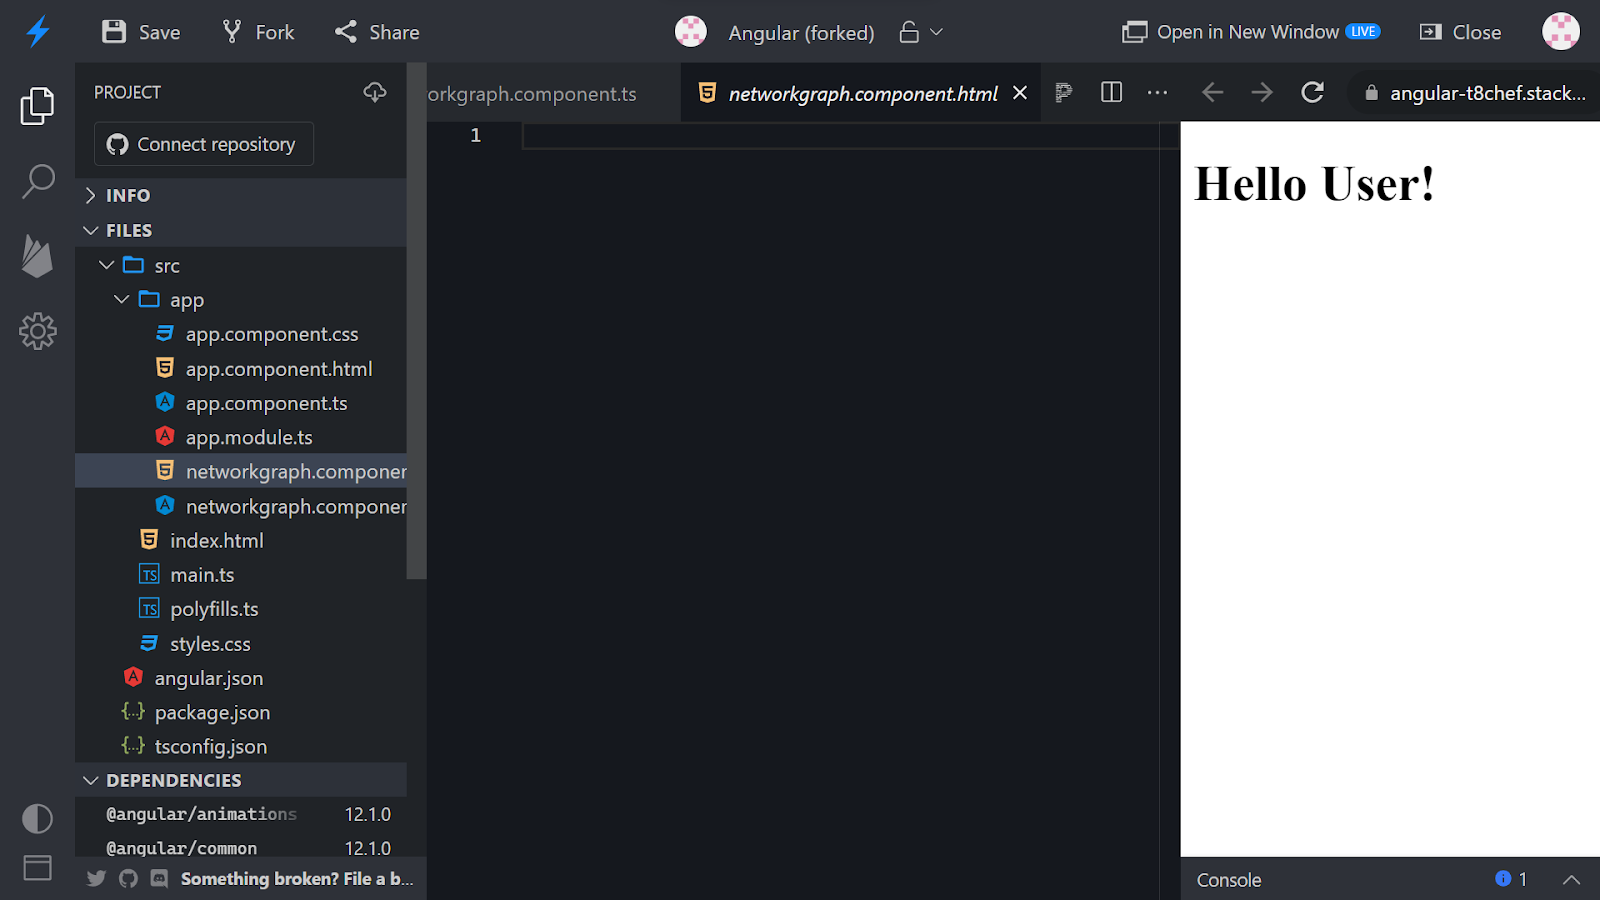
Once you click on the above link, you will be navigated to an online compiler as shown in the image below. This is the default layout that is created for us. Stackblitz even allows us to link our projects to the GitHub repository which makes it easy for us to keep a record. The below file is the main component typescript file.
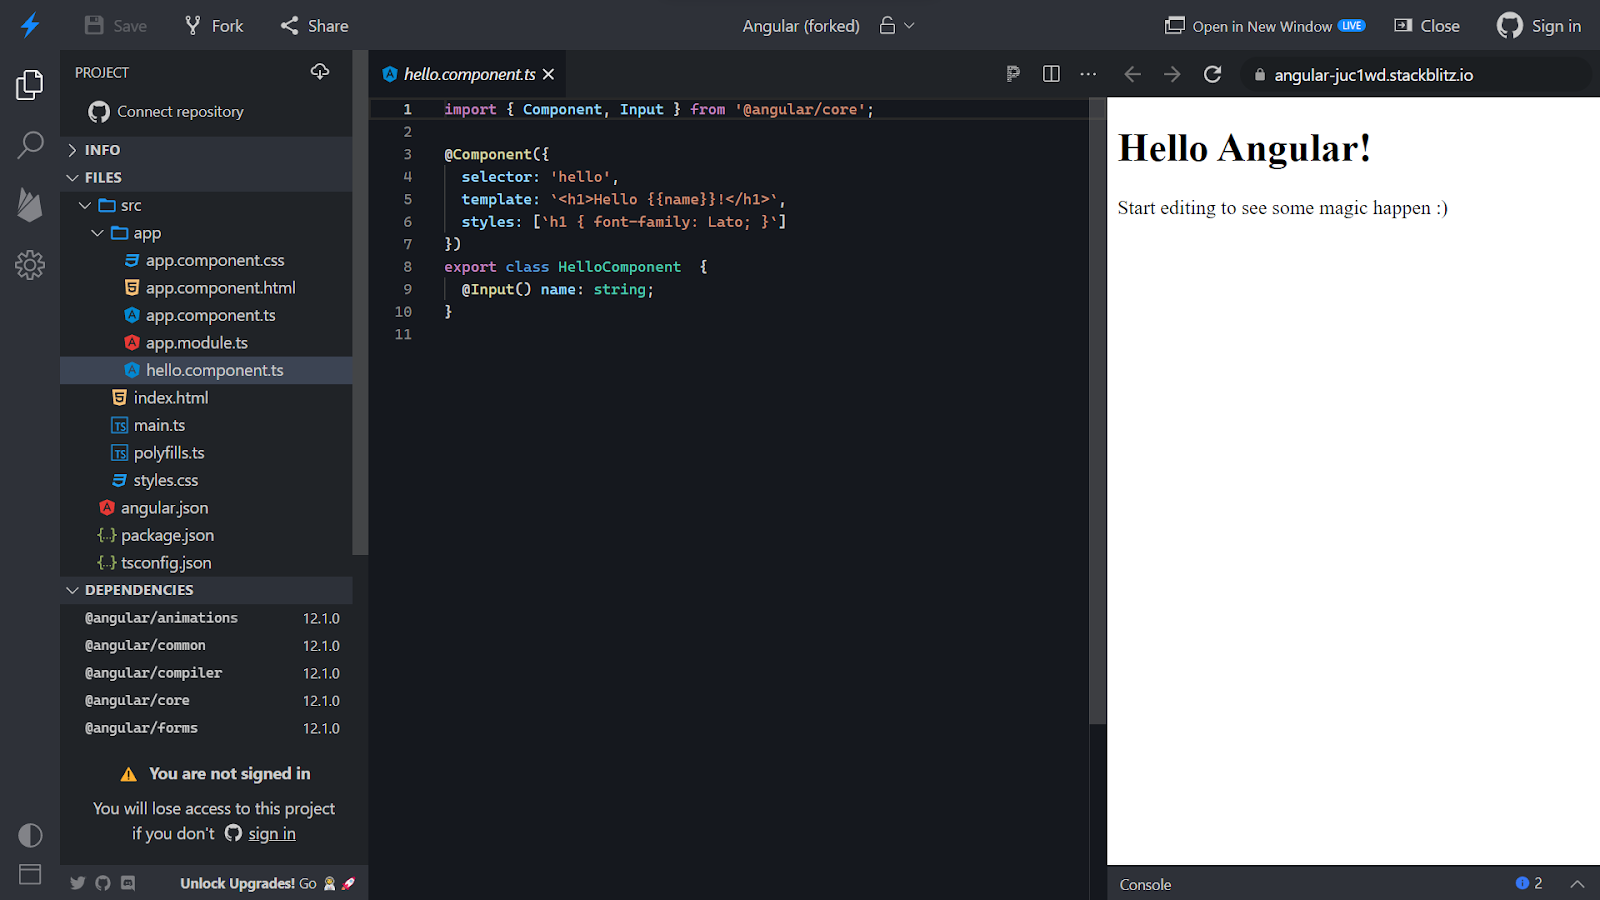
A default file is created with the name hello.component.ts which takes input for the name from the app.component.ts file as shown in the image below using the Input decorator.
Rename the hello.component.ts file to networkgraph.component.ts file.

Navigate to the code in that file and replace the selector and the class name of that file.
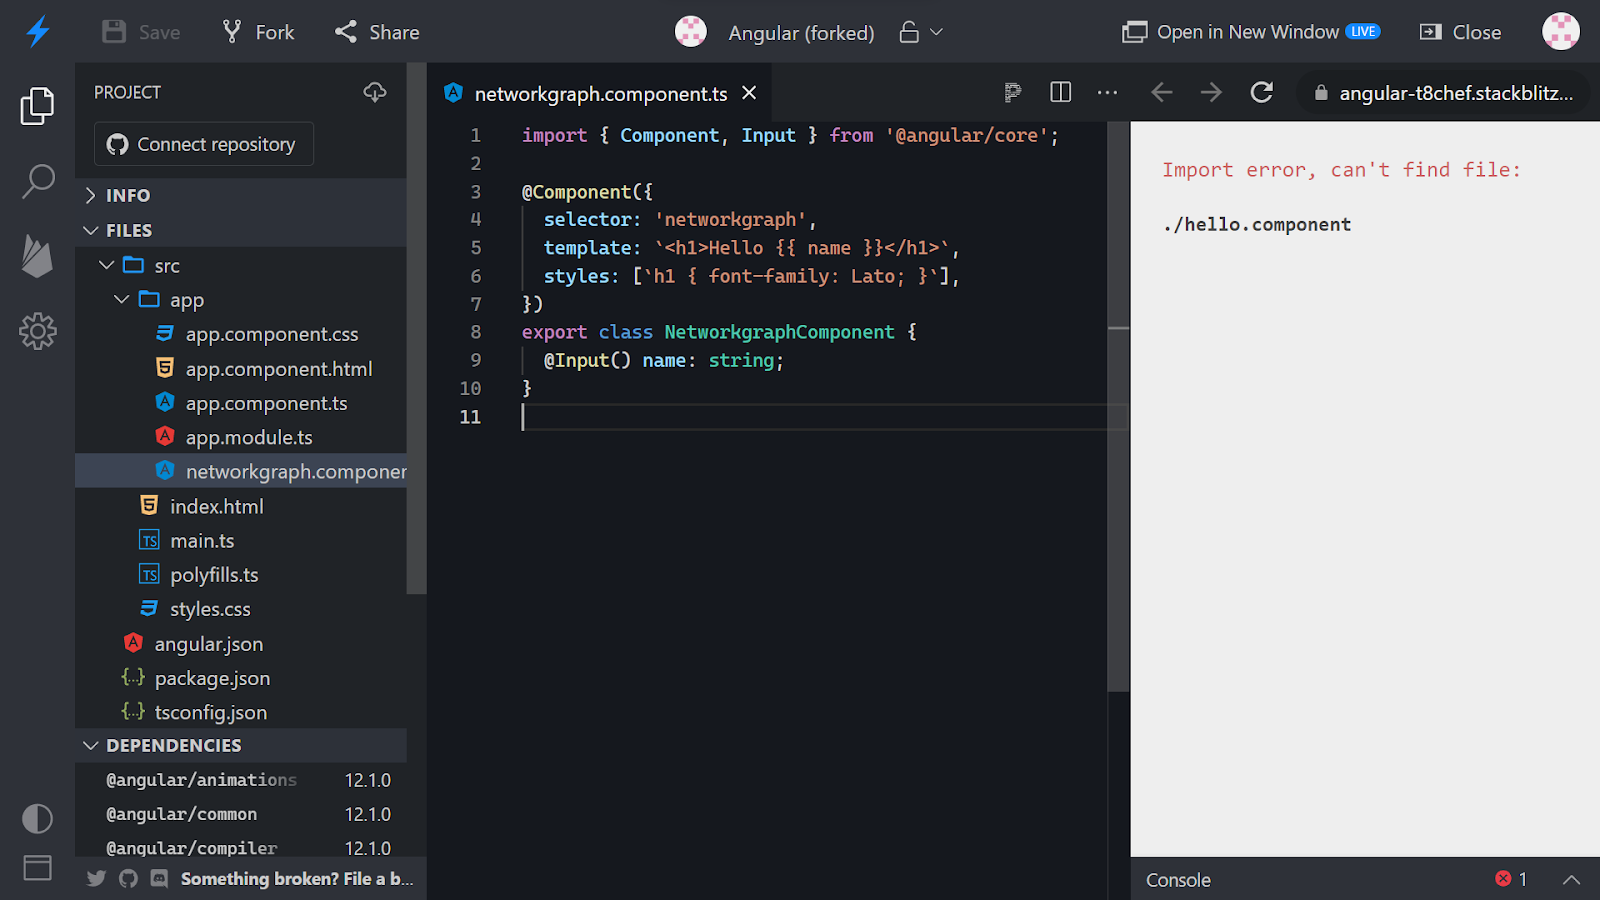
Open the app.module.ts file and replace HelloComponent with NetworkgraphComponent.

In case you wish to change the name input parameter on the HTML page, open the app.component.ts file and change the value of the name variable. You will see the same reflected on the HTML page.
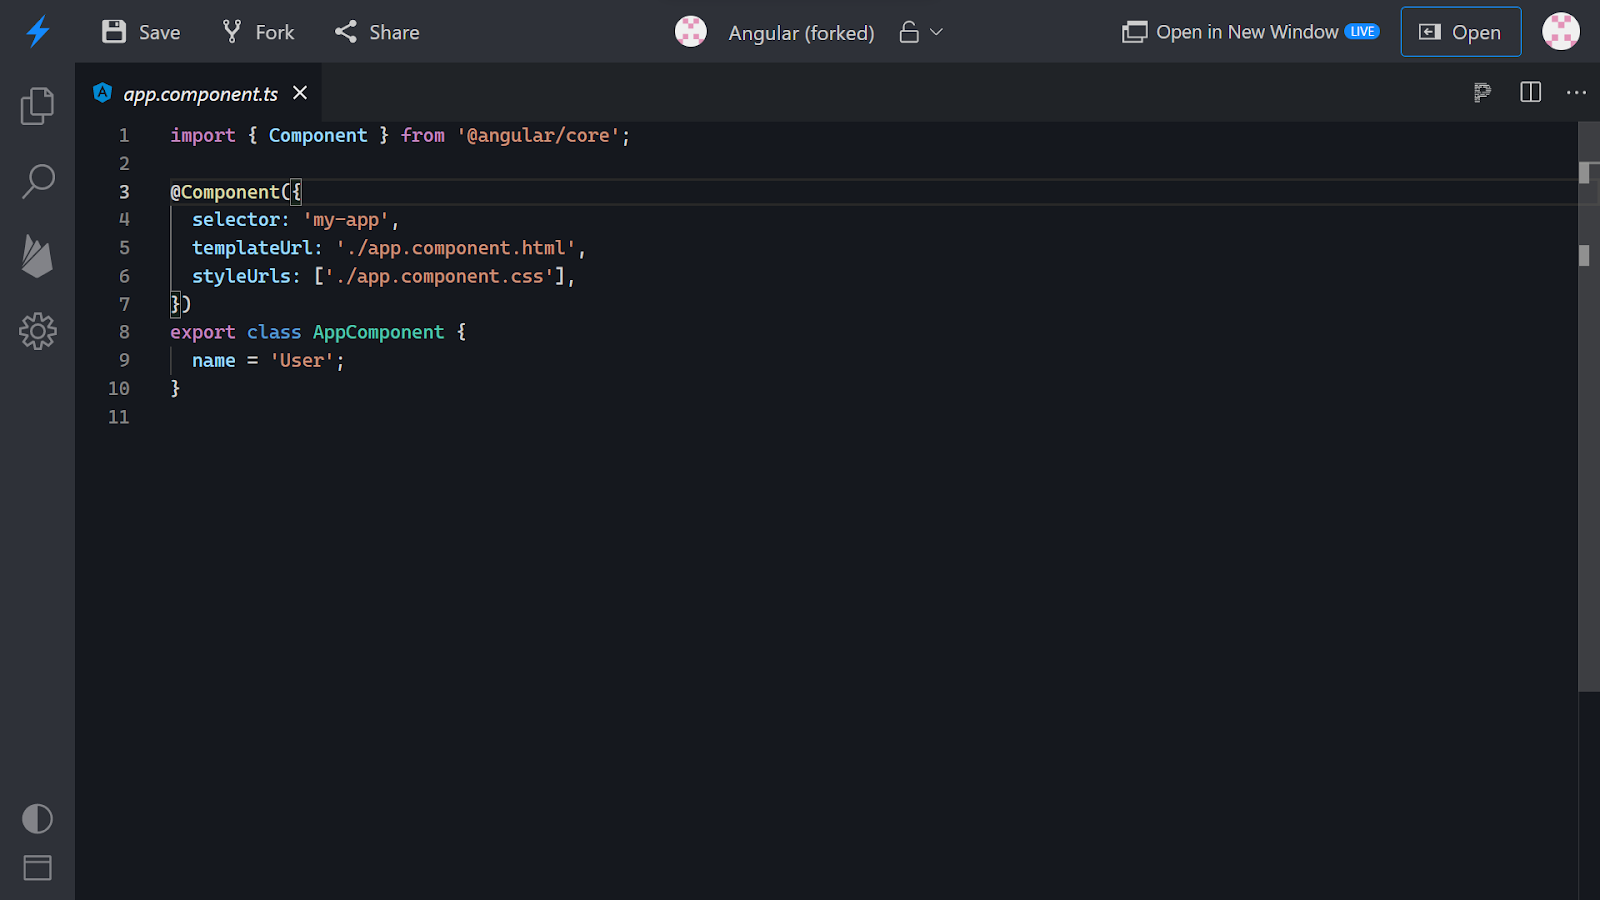
The value is reflected on the UI.

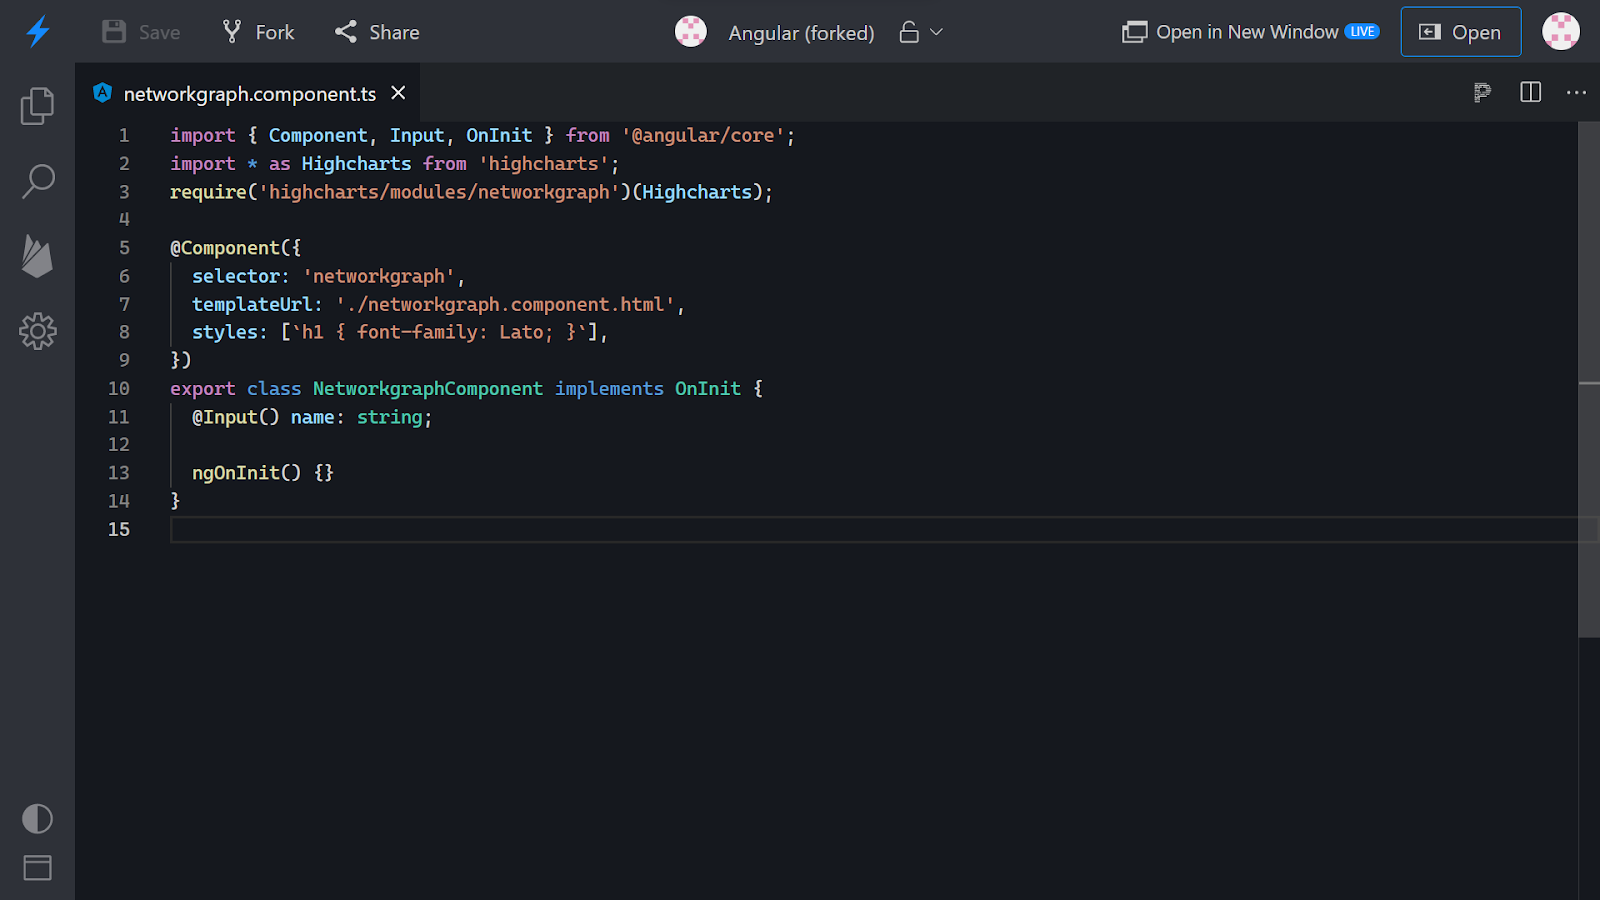
We need to add a ngOnInit() lifecycle so we will extend the class to OnInit and add the lifecycle inside the class.

In the left navigation pane, create a new file with the name networkgraph.component.html.
Open the networkgraph.component.ts file and change the template key-value pair to templateUrl as the key and the value targeting the newly created HTML file.

Navigate to the networkgraph.component.html file and add the below content and you will see the same reflected on the UI.

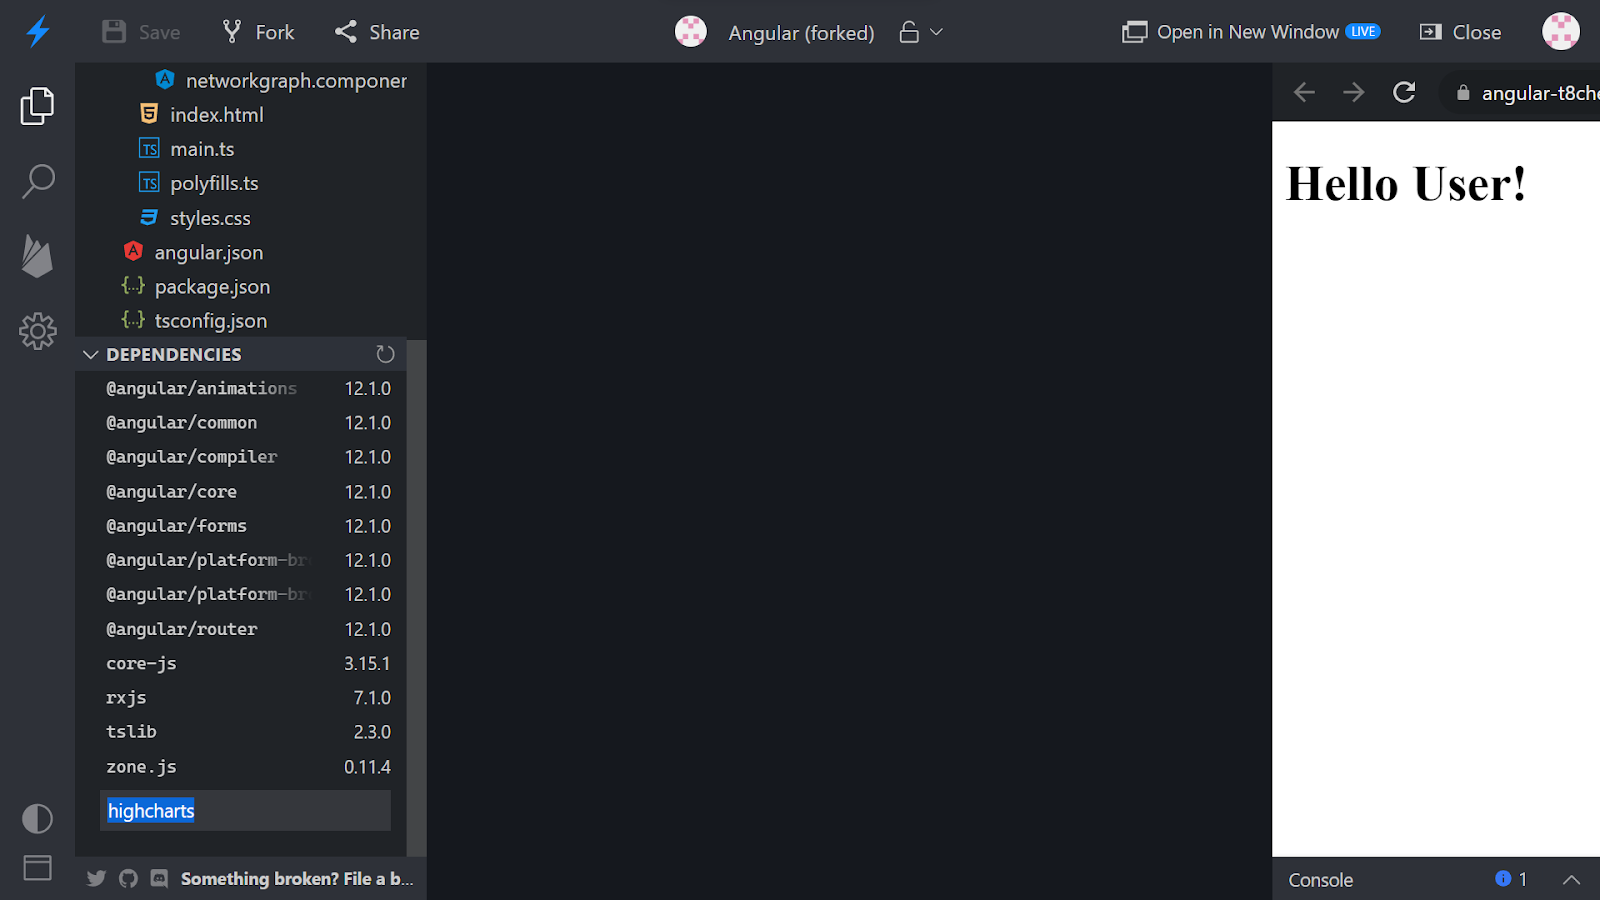
Now, we need to install the highcharts package. To do so, under the dependencies section, enter the name ‘highcharts’ and hit enter. The package will be installed.
Open the package.json file and cross-verify the highcharts package installation.

Post that, we will install the highchart angular wrapper. To do so, under the dependencies section in the left navigation pane, type in highcharts-angular and hit enter.

Cross verify the package installation in the package.json file.

Now, open the app.module.ts file.

Import the HighchartsChartComponent from the angular wrapper and declare the same in the declarations section.

Now, open the hello.component.html file and add the below code. This will plot the charts on the UI screen.

Open the networkgraph.component.ts file and import highcharts.

You can close the UI preview meanwhile while we code and complete the required process by clicking on the Close button on the top of the screen.
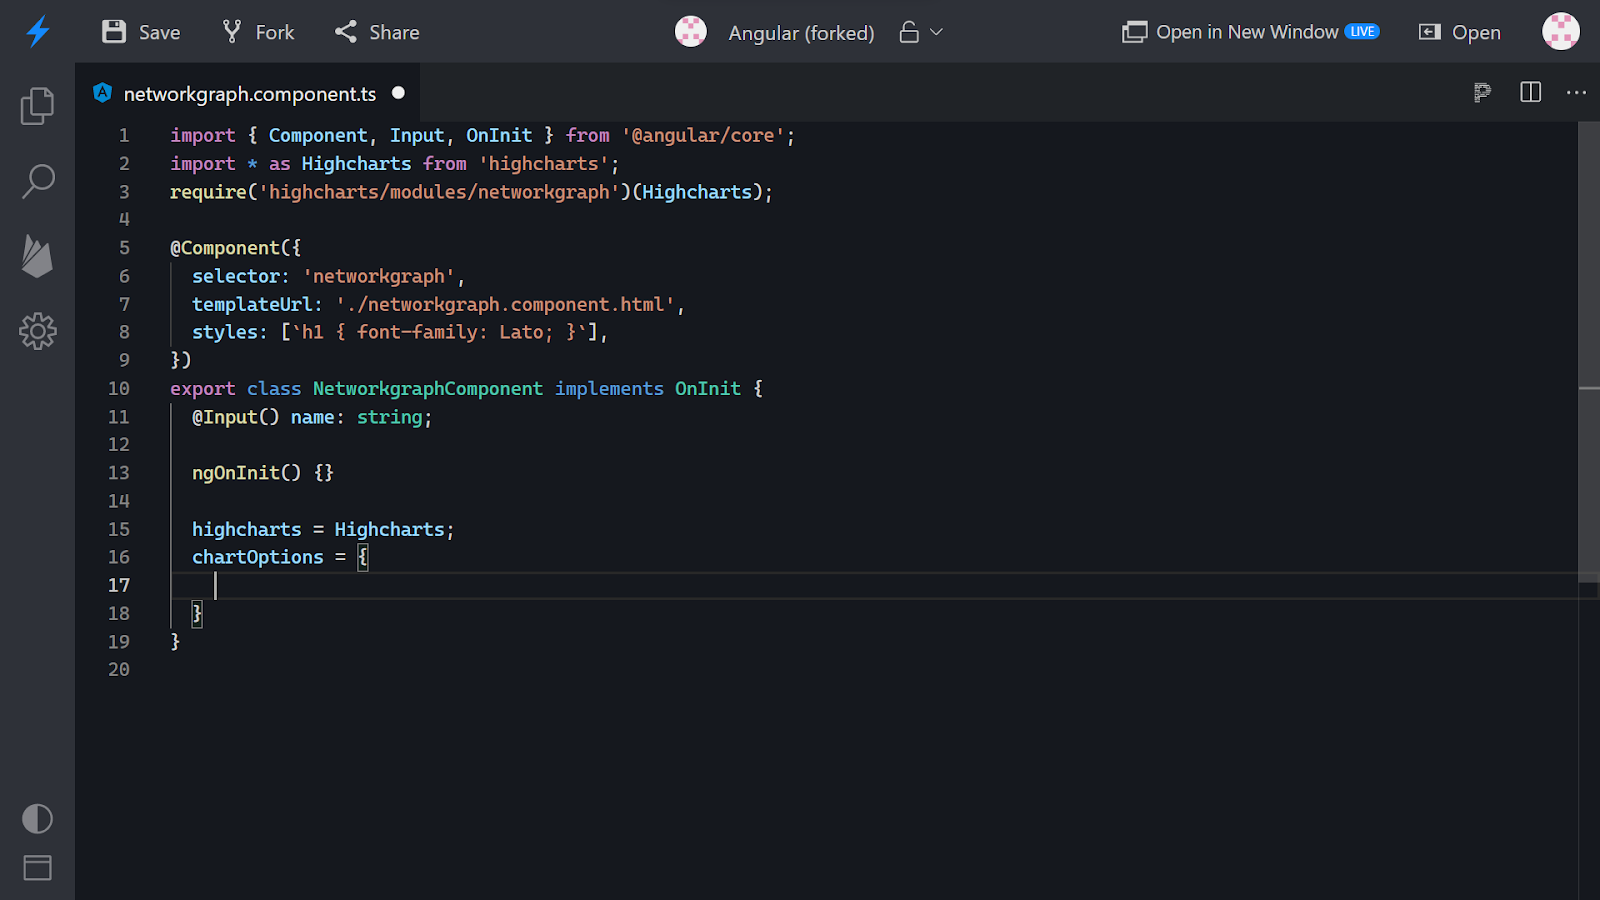
For configuring the Highcharts, create Highcharts and create chartOptions for configuring the type.
We need to define the type of chart inside the chart options. Choose the type as networkgraph.

Add another key layoutAlgorithm with an internal property enableSimulation setting it to true. This is for enabling simulation for having an interactive network graph.

Then we’ll add another key series that will consist of setting a width for the links of a network graph and will enable the visibility of labels on a network graph.

Then we’ll add the data parameter with the required data that we need to plot.

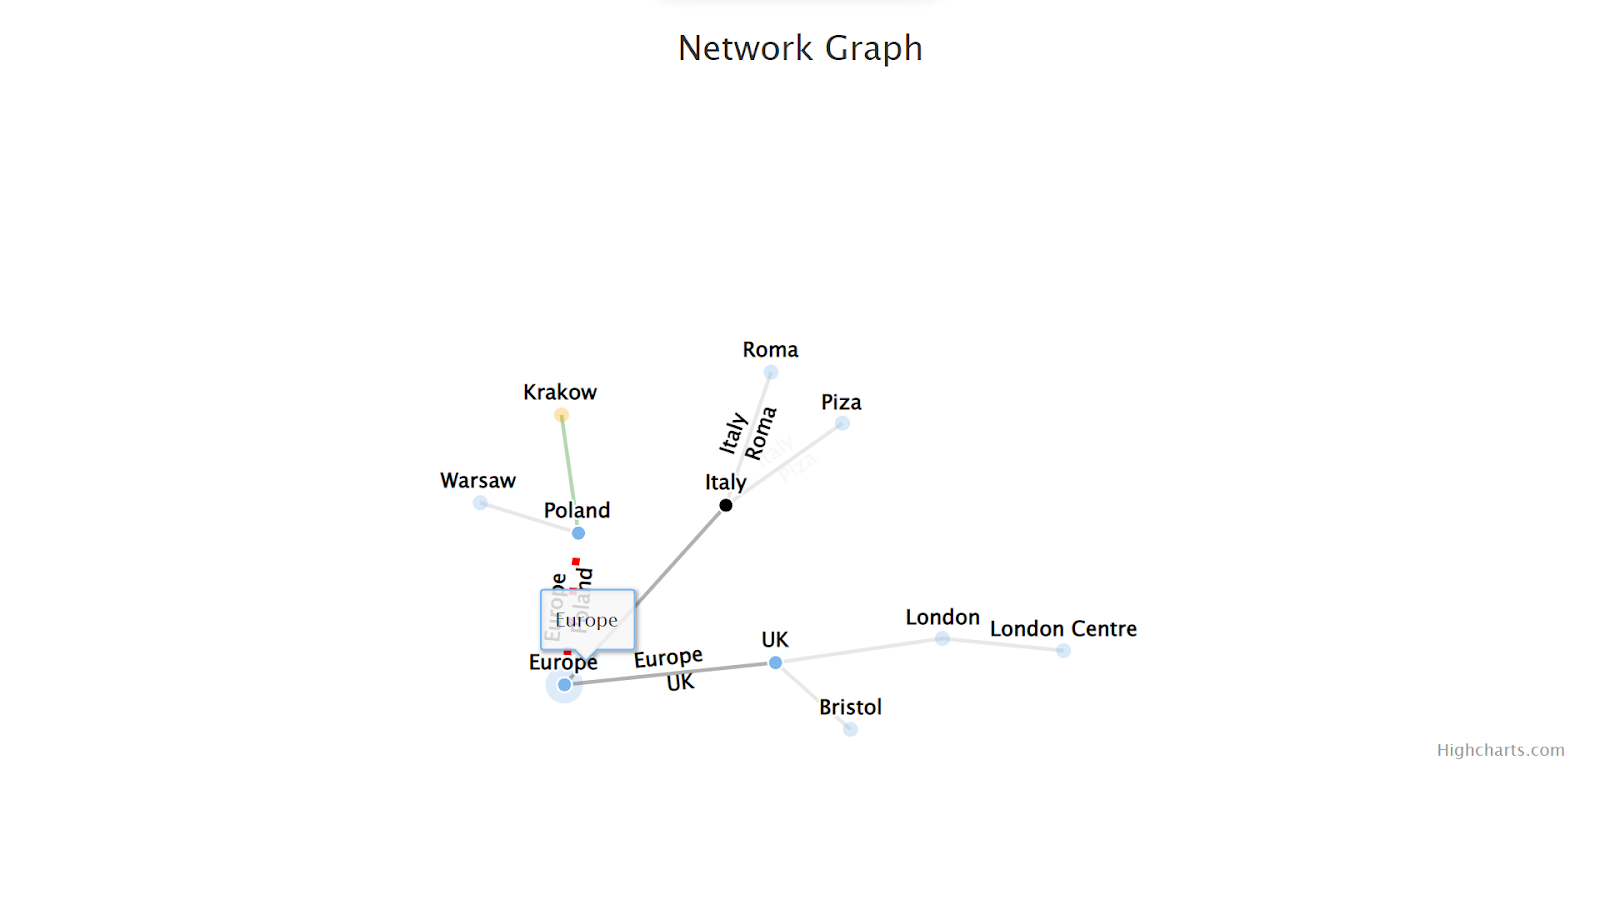
Once done, save the file and open a preview of the UI. You will see the graph plotted on the UI. As per the data that we added.

Click on open in a new window to view the graph in a separate window in your browser.

Commenting the unwanted part in the networkgraph.component.html file.

To add a title for the graph, add a new key with the name title and add the title as a value of the text property.

Now, if you open the graph in a new window, you will see the title updated.

Since we enabled data labels to be true, if you hover over the nodes, you’ll see the name of that node. The nodes are interactive as well. So, if you click on a node and drag, the position of that node will change.
Conclusion
In this hands-on, we began with an online compiler for angular called StackBlitz which gives us the flexibility of an already created folder structure. We used this compiler to create flexibility for users to plot network graphs with the provided data. We first began with exploring the files created by default and then altered the folder structure as per our need. Providing proper naming conventions for the file, we created a new HTML file, then we altered the input parameter value and changed the template URL to point to the newly created HTML file for the child component.
We then installed the highcharts and the highchart angular wrapper to be able to plot the network graphs. Post that we imported the highcharts component into the app module file. To test out the configuration of highcharts we then created a network graph utilizing the various different parameters offered by highcharts and had a look at the different features offered. We will come up with more such use cases in our upcoming blogs.
Meanwhile…
If you are an aspiring Angular Developer and want to explore more about the above topics, here are a few of our blogs for your reference:
- How to enhance UX by managing API requests using Angular Resolver?
- How to plot Bar Charts in Angular using npm package Highcharts?
- How to export datasets into CSV format using Angular with FileSaver?
Stay tuned to get all the updates about our upcoming blogs on the cloud and the latest technologies.
Keep Exploring -> Keep Learning -> Keep Mastering
At Workfall, we strive to provide the best tech and pay opportunities to kickass coders around the world. If you’re looking to work with global clients, build cutting-edge products and make big bucks doing so, give it a shot at workfall.com/partner today!