AWS X-Ray helps developers to analyze and debug production and distributed applications. It helps developers in understanding how applications and their underlying services are performing to identify and troubleshoot the root cause of performance issues and errors. In this blog, we will explore how we can make use of AWS X-Ray to monitor, trace and debug Lambda functions eliminating the need for manual intervention of each execution. We will test the trace map for both — the successful and failed executions of the Lambda function. Let’s explore!
In this blog, we will cover:
- What is AWS X-Ray?
- AWS X-Ray components
- Features of AWS X-Ray
- Companies using AWS X-Ray
- Hands-on
- Conclusion
What is AWS X-Ray?
Debugging applications is the most critical part of the software development process. Developers always require some good tools which can help in debugging applications. AWS X-Ray is the developer’s buddy and helps developers analyze and debug applications using distributed tracing. Using X-Ray developers can pinpoint and understand the root causes of issues, errors, and bottlenecks of the applications.
With X-Ray, developers can identify which part of the application is causing the issue and see the details of the requests being made to the app such as their latency, errors, HTTP response status, etc. Developers can easily understand where mistakes are occurring thanks to X-visual Ray’s map of the application’s architecture. Apps running on EC2 or in containers via the EC2 container service are straightforward to analyze with X-Ray. It can also determine the impact of faults on the application’s users. It can display the application’s service call graph.

As shown in the above image, AWS X-Ray has two main components X-ray SDK and X-ray daemon. There are X-ray SDKs for Java,.NET and Node.js. It allows you to get up and running quickly without having to manually direct your application code to log request metadata. The X-ray daemon collects metrics generated by the SDK and runs on your instances, whether they’re on-premises, in AWS, or even in a Lambda function. It operates as a local buffer and gets data from the SDK over UDP.
The X-Ray SDK provides:
- Interceptors — trace incoming HTTP requests
- Client handlers — call other AWS services
- HTTP client — calls to other HTTP web services, both internal and external
The SDK also includes functionality like instrumenting SQL database calls, automatic AWS SDK client instrumentation, and more.
X-Ray creates a detailed service graph using trace data from AWS resources that support cloud applications.
As shown in the below image, the service graph shows the client, front-end service, and backend services that front-end service calls to process requests and persist data.
The service graph can be used by developers to discover bottlenecks, latency spikes, and other issues that need to be addressed in order to improve the performance of their applications.

Consider the situation where you are pushing data into DocumentDB and it’s not scaling quickly, which is getting you throttled and you want to figure out the requests that are getting throttled. It is very easy to do.
You have a Trace ID or a series of them, and you can add “throttled” in brackets on the DocumentDB service or in the name of your document, and it will find all of the throttled traces. These traces can be associated with a variety of metadata.
AWS X-Ray components
Features of AWS X-Ray

Companies using AWS X-Ray

Hands-on
In this hands-on, we will implement the execution of a Lambda Function by monitoring and tracing its execution using AWS X-Ray.
To implement this, we will do the following:
- Sign in to your AWS console.
- Create a Lambda function that is to be monitored by AWS X-Ray.
- Enable Active Tracing for your Lambda Function.
- Create a test event for your Lambda Function.
- Test your Lambda Function using the test event.
- Navigate to the AWS X-Ray console and wait for a few minutes for the service to compute a traced map.
- View the traces for further details.
- Create a test scenario for a failed execution and repeat the steps.
The following image represents the flow of the implementation

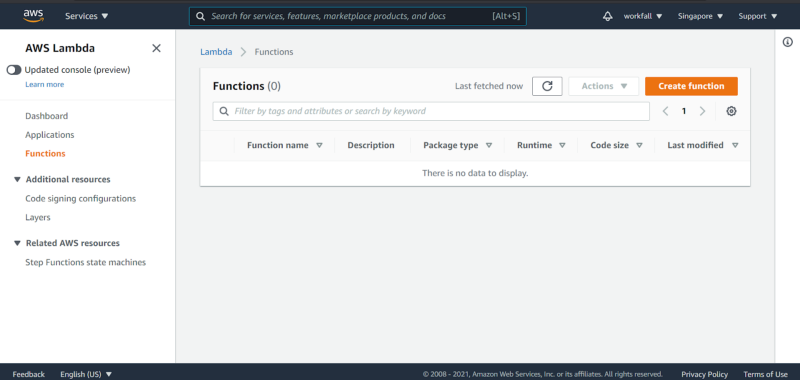
Login to your AWS console and navigate to the AWS Lambda console. Click on ‘Functions’ mentioned in the left navigation pane.
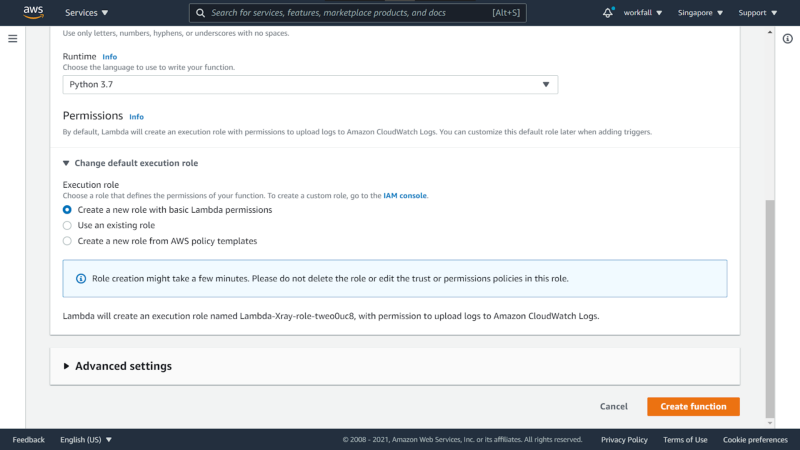
Click on ‘Create Function’. Select ‘Author from scratch’, enter the function name, select the runtime as ‘Python 3.7’.

Scroll down and under the Execution role, select ‘Create a new role with Basic Lambda Permissions’. Once done, click on ‘Create Function’.
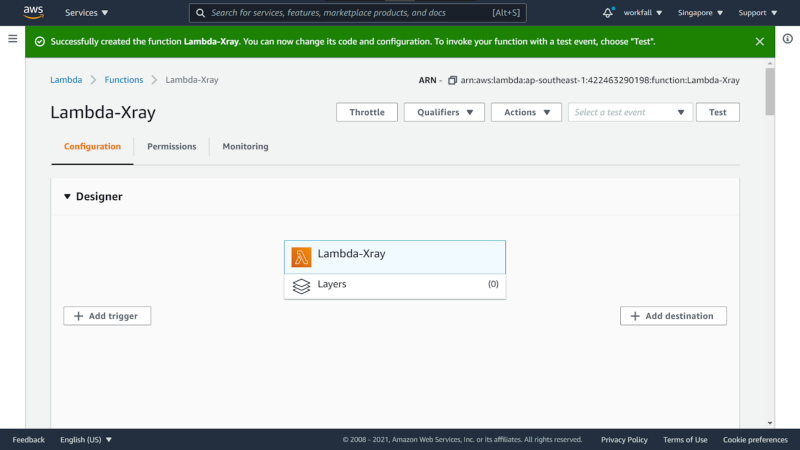
Upon clicking on ‘Create function’, you will be navigated to the function console with the success message.
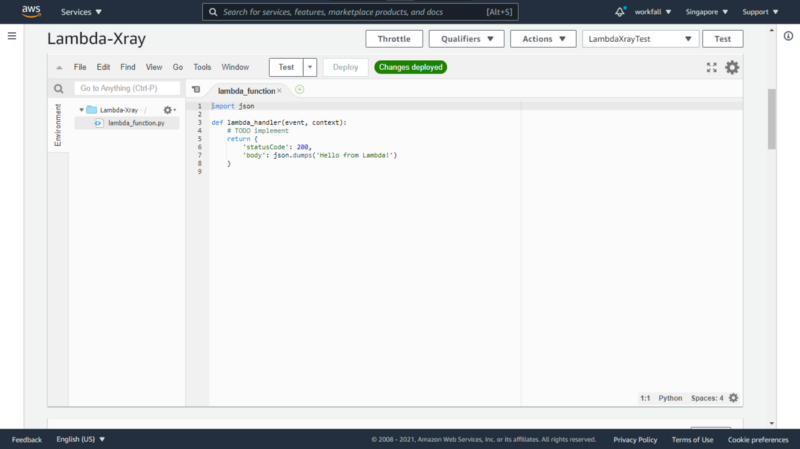
Now scroll down to the function code in the editor pane and click on ‘lambda_function.py’.

You will see some sample code in the editor pane for the same function.

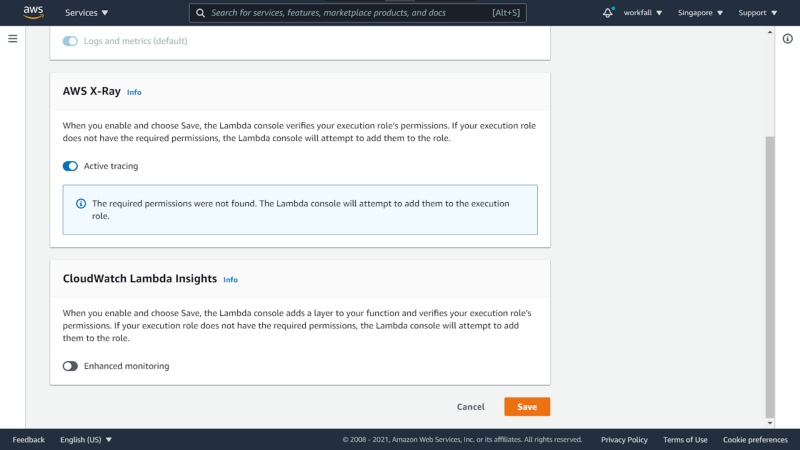
Now scroll down to the Monitoring tools section on the Lambda dashboard and click on edit.

You will be navigated to the Edit monitoring tools dashboard. Enable the switch on the left of Active Tracing under the AWS X-Ray section.
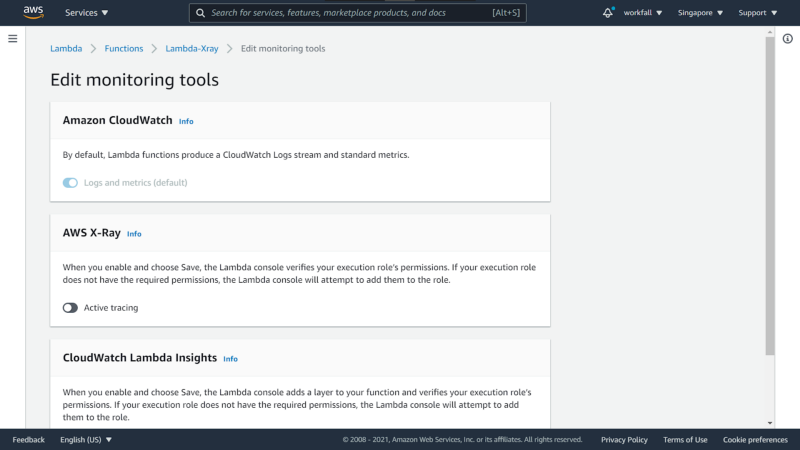
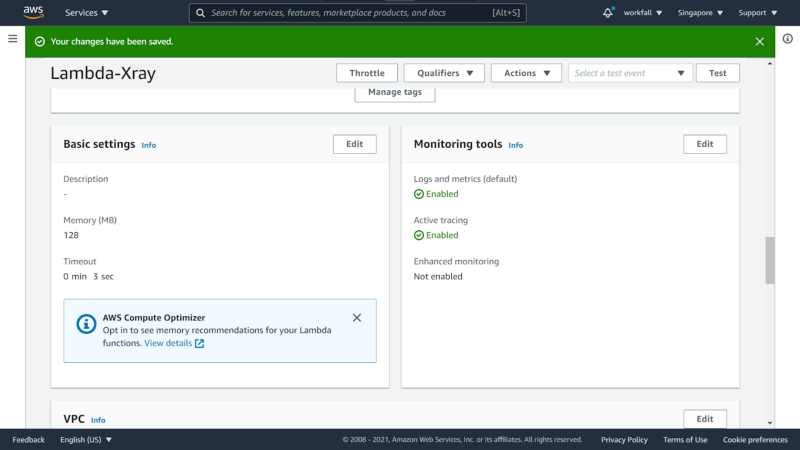
Scroll down and click on Save to let AWS X-Ray monitor and trace the actions you perform on the Lambda function.
You will notice the ‘Active tracing’ option switched to Enabled.
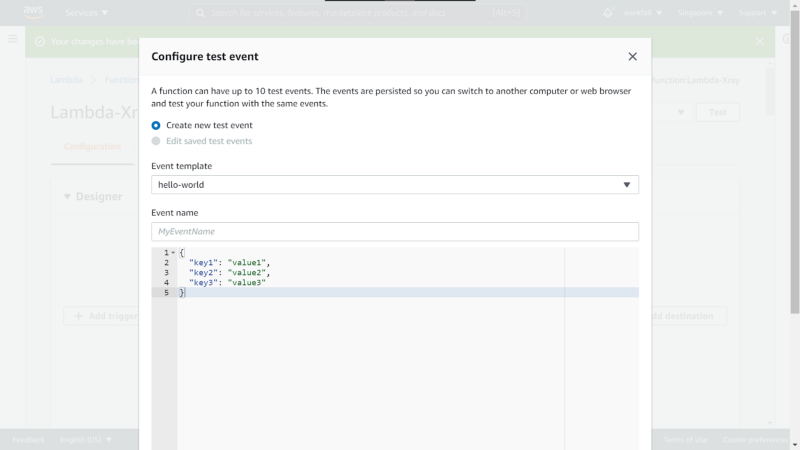
Now navigate back to the top of the Lambda Dashboard and click on Test.

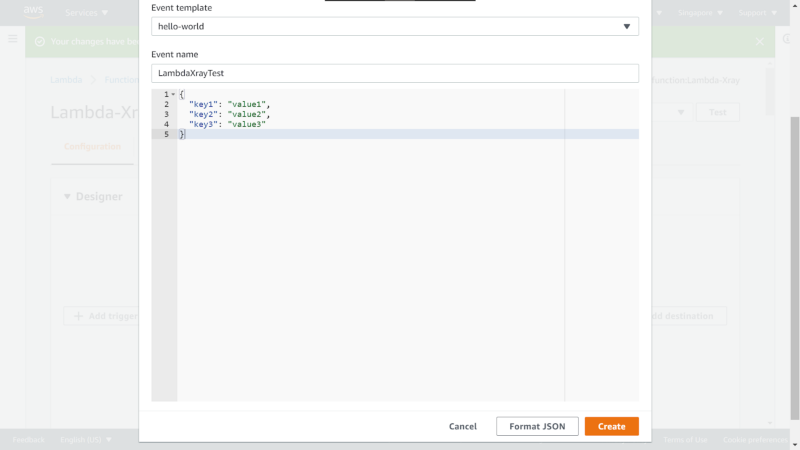
A modal to set the configuration for the test event appears. Enter a name for the test event.
Scroll down and click on Create.
Now navigate back to the editor pane of the lambda function.

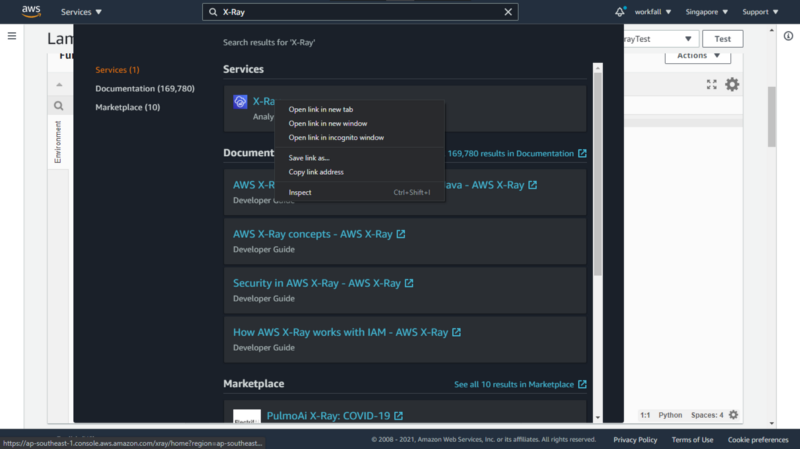
On the top, search for X-Ray.

Right-click on the service and click on the Open link in the new tab.
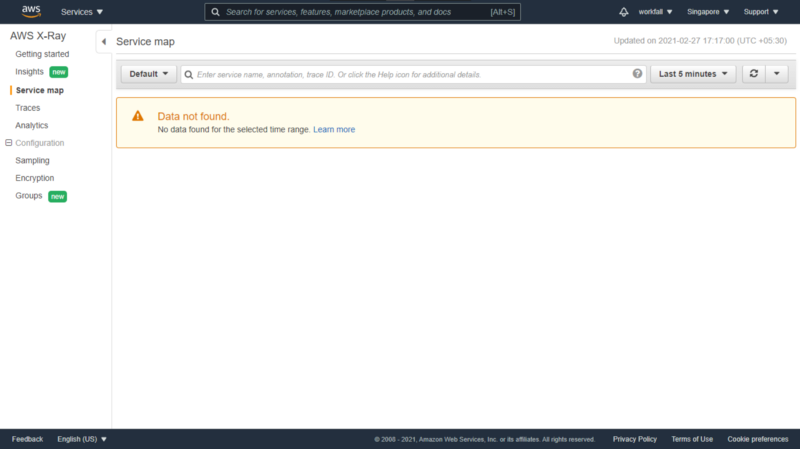
You will be navigated to the AWS X-Ray dashboard. Click on ‘Service map’ in the left navigation pane. You won’t see any data since you haven’t performed any action on your lambda function yet.
Navigate back to the Lambda functions editor pane and click on ‘Test’.
You will see the Execution results in a new tab. Now, hit on ‘Test’ multiple times so that AWS X-Ray can trace your actions and form a computing map.

Navigate back to the AWS X-Ray dashboard. Wait for a few minutes and hit Refresh.

After a few minutes, you will see a Computing map on the screen with a loader.

Once loaded, you will see the traced map on the dashboard.
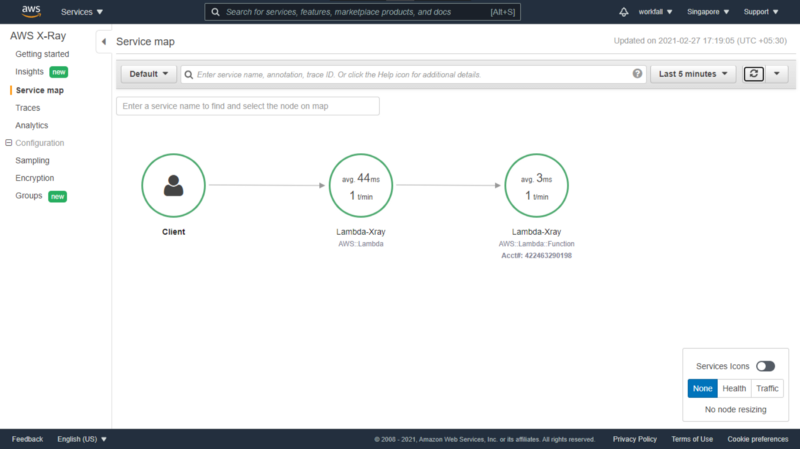
On the bottom right of the screen, to see the services icons, enable the Service icons option.

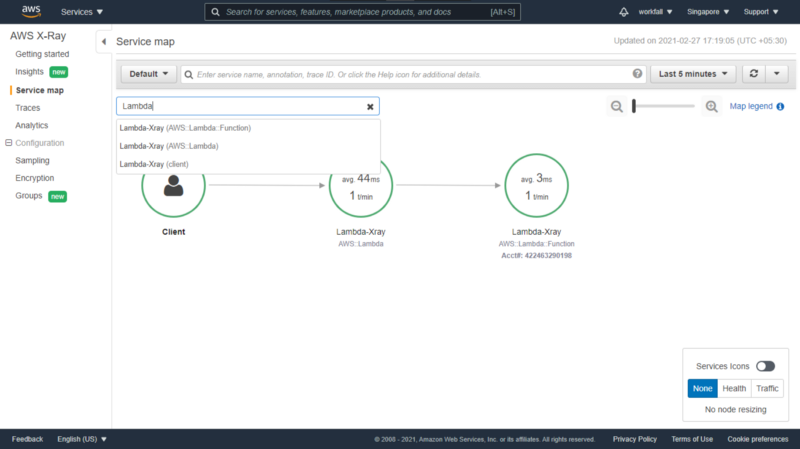
You can also search for the service for which you have enabled active tracing as shown below.
To see further trace details, click on the service on the map. On the arrows, you will see the success/error rate. As you can see below, the success rate is 100% for the function execution.
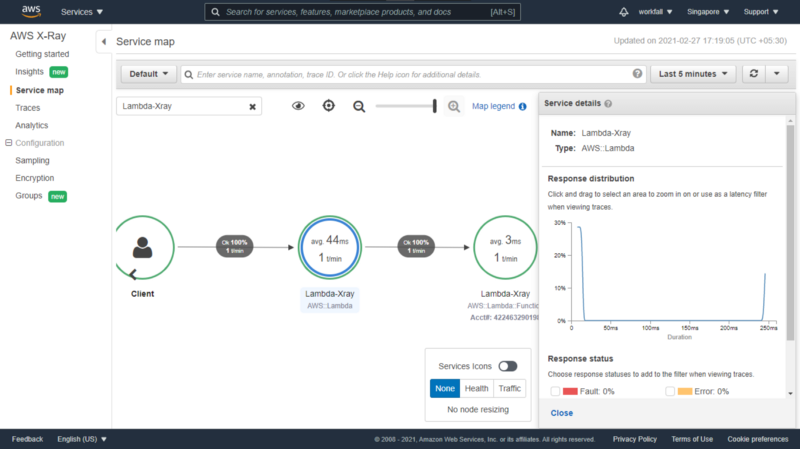
The further details for the Lambda function.

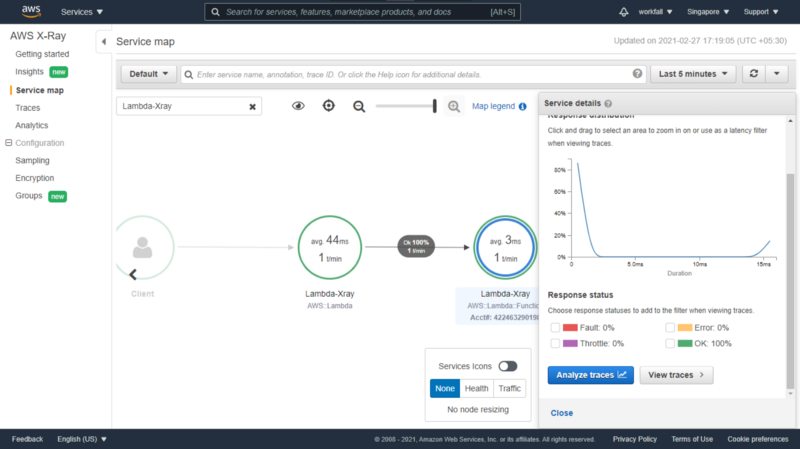
Now, scroll down on the ‘Service details’ modal and click on View traces.
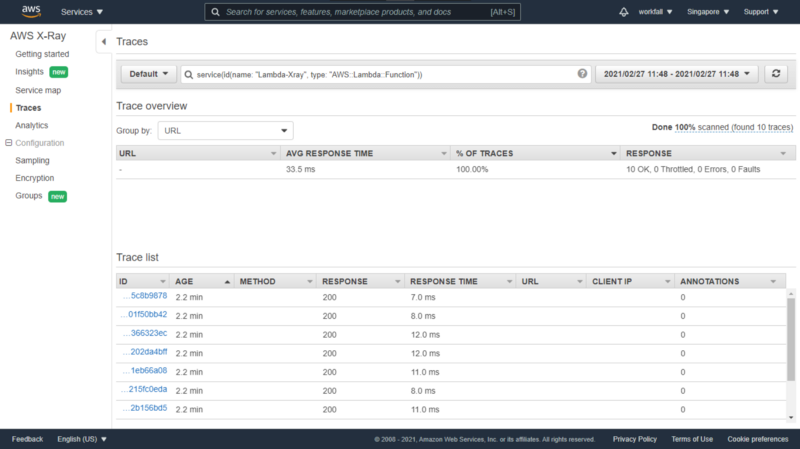
You will see the execution results in the Trace list for your lambda function.

Now, to get the details of the latest execution, under the Trace list, click on the arrow on the right of it to filter and get the latest execution.
Now click on the ID of the latest execution from the Trace list section.

Below you can see the further details for your lambda function. Under the Trace map, you can view the response rate as well if you click on the function in the trace map.

To view the response in JSON format, click on the Raw data tab.

Let’s test a negative scenario. Navigate back to the Lambda Function. Alter the function as shown below.

Once done, click on Deploy to deploy the function and click on Test.

You will see that the execution will fail.
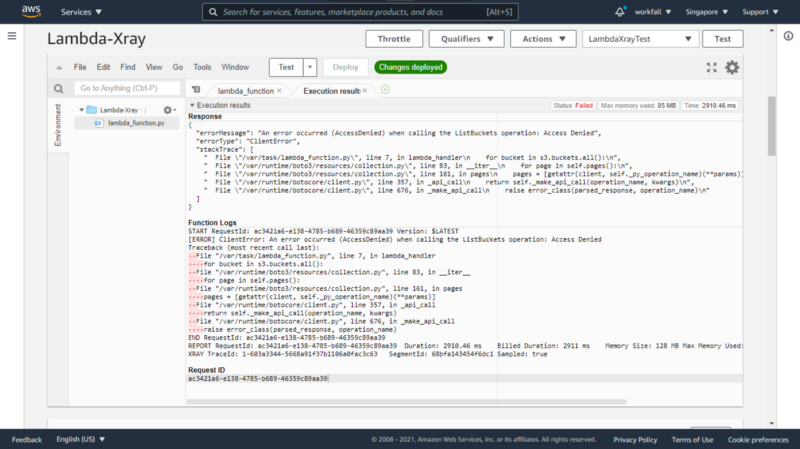
Now, navigate back to the AWS X-Ray dashboard and hit on Refresh.

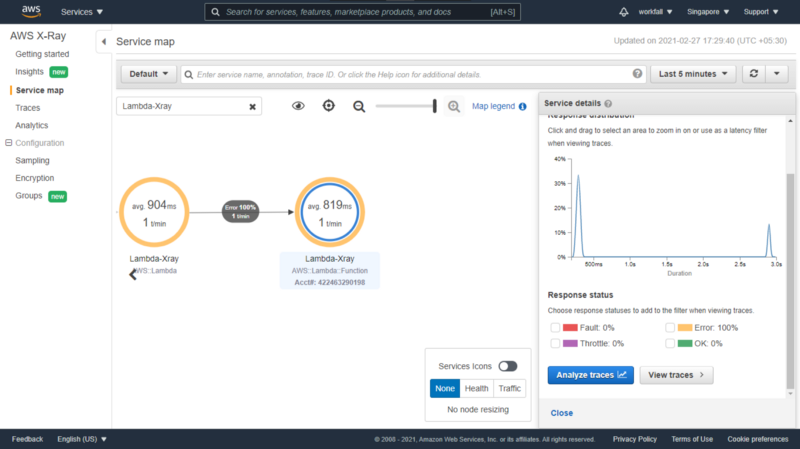
Under the Service map, the color changes for the Lambda function. Select it and scroll down in the Service details modal. In the Service details modal, you will see that the Error rate shows 100% now. Click on View traces.
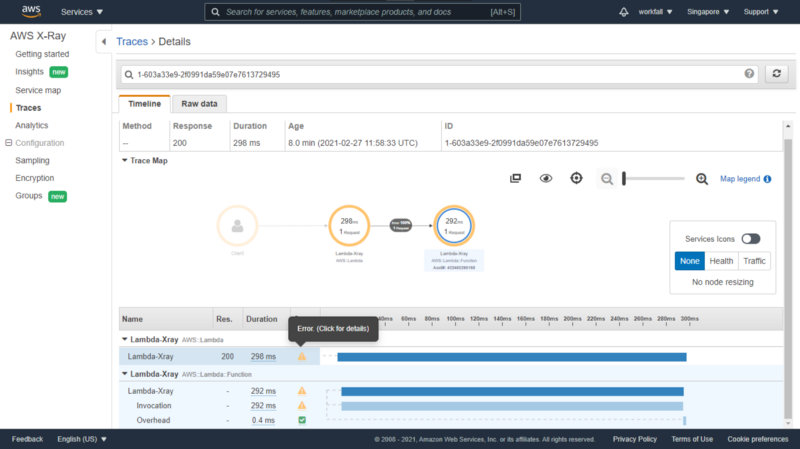
On this dashboard, you can see all the details for the execution of your Lambda function. In the details pane below, you will see the status shown as a warning sign.

When you hover over the warning sign, you will see a message ‘Error (Click for details)’ as shown below. Click on it to see further details.
A modal will appear with the details for your Lambda function execution. Under Errors & Faults, you will see the Error’s value as true.

This is how AWS X-Ray can monitor and trace all the actions you perform on your Lambda Function and provide each and every minute detail for the same.
Conclusion
In this blog, you have seen how to use AWS X-Ray to instrument your lambda function. Using AWS X-Ray, you can easily monitor, trace and debug your lambda functions without the burden of monitoring your executions or debugging your lambda functions manually. We will discuss more of AWS X-Ray and its other implementations in our upcoming blog. Stay tuned to keep getting all updates about our upcoming new blogs on AWS and relevant technologies.
Meanwhile …
Keep Exploring -> Keep Learning -> Keep Mastering
This blog is part of our effort towards building a knowledgeable and kick-ass tech community. At Workfall, we strive to provide the best tech and pay opportunities to AWS-certified talents. If you’re looking to work with global clients, build kick-ass products while making big bucks doing so, give it a shot at workfall.com/partner today.