S3 Storage Lens is a recently launched service of AWS for S3 which provides S3 storage analytics and insights. S3 storage lens is also the first-ever cloud storage analytics solution initially introduced by AWS.
The S3 storage lens increases object storage visibility into S3 buckets. When you are storing objects in S3 from hundreds to thousands or millions and billions, then it becomes necessary to have deep visibility into your objects as they incur costs. AWS always comes up with feasible solutions and services that help big organizations as well as startups to cost-effectively manage their resources.
You can access the S3 storage lens using AWS Management Console, AWS SDKs, AWS CLI, or REST API.
S3 storage lens provides interactive dashboards for analyzing data of the entire organization, single or multiple accounts, specific regions, or buckets. It provides more than 30 metrics to visualize the S3 storage usage and account activity of the organization. You can also export metrics in CSV and Apache parquet format in the S3 bucket of your choice to further enhance your view.
The S3 storage lens provides 2 types of metrics:
Usage Metrics: The usage metric is related to the size, quantity, and characteristics of your storage. It includes total byte stored, object count, and object size, and additionally also includes encrypted bytes and delete market object count. Usage metrics are available free of cost.
Activity Metrics: If you are subscribed to advanced metrics and recommendation metrics, then you are eligible for activity metrics. It is related to how often storage is requested. It includes requests by type, upload, and downloads bytes and errors. Activity metrics are available with the cost.
Once you create the dashboard, it will be updated daily if enabled. You can create up to 50 dashboards per home region.
Every customer of AWS gets a default dashboard set up for them to analyze S3 storage. You can also modify that default dashboard according to your significant usage. You can enable advanced metrics on this dashboard.
Let’s do some hands-on to better understand the S3 storage lens and how it could benefit your organization.
In this exercise, first, we will create an S3 bucket and upload some objects to it.
So, let’s create an S3 bucket in the North Virginia region (us-east-1).

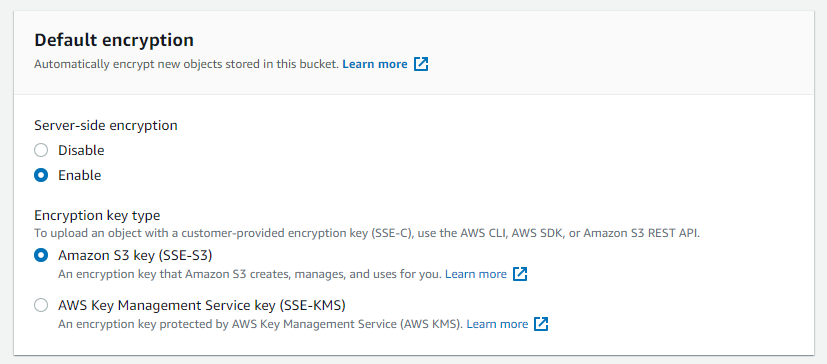
For Default encryption, we are enabling the encryption with Amazon S3 Key (SSE-S3).
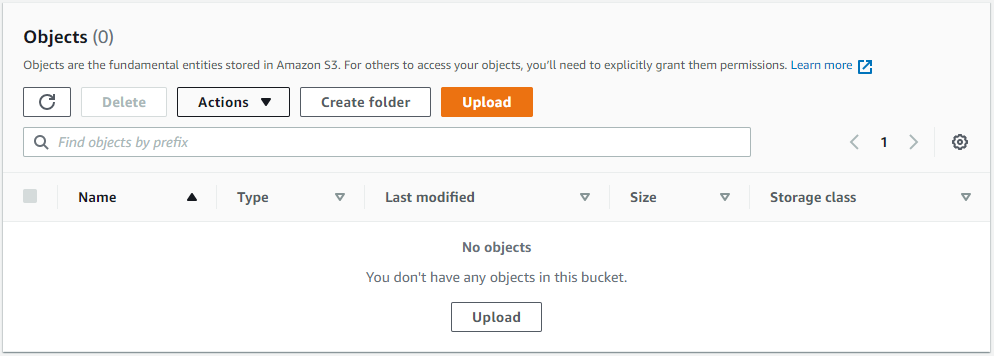
Then, click on Create a bucket and a bucket will be created. Now, select the bucket you created and click on it.

We will upload some objects inside our bucket workfallbucket-test.
Let’s create two folders in this bucket.
One can be a CSV folder for storing CSV files and another one can be an image folder for storing images.
Then, upload the required files into the respective folders.

We will also create one bucket as a destination bucket in the Ohio region (us-east-2). We will name this bucket as workfall-destination. This bucket will store the metrics data which will be exported every 24 hours.
Note: The destination bucket should be created in the region where your dashboard is created.
Now, we will create a dashboard using an S3 storage lens:
From the navigation bar, head towards the S3 storage lens, and from the dropdown, select Dashboards and you will be redirected to the S3 storage lens console. Now, click on Create Dashboard.

We will name our dashboard as workfall-dashboard-demo.
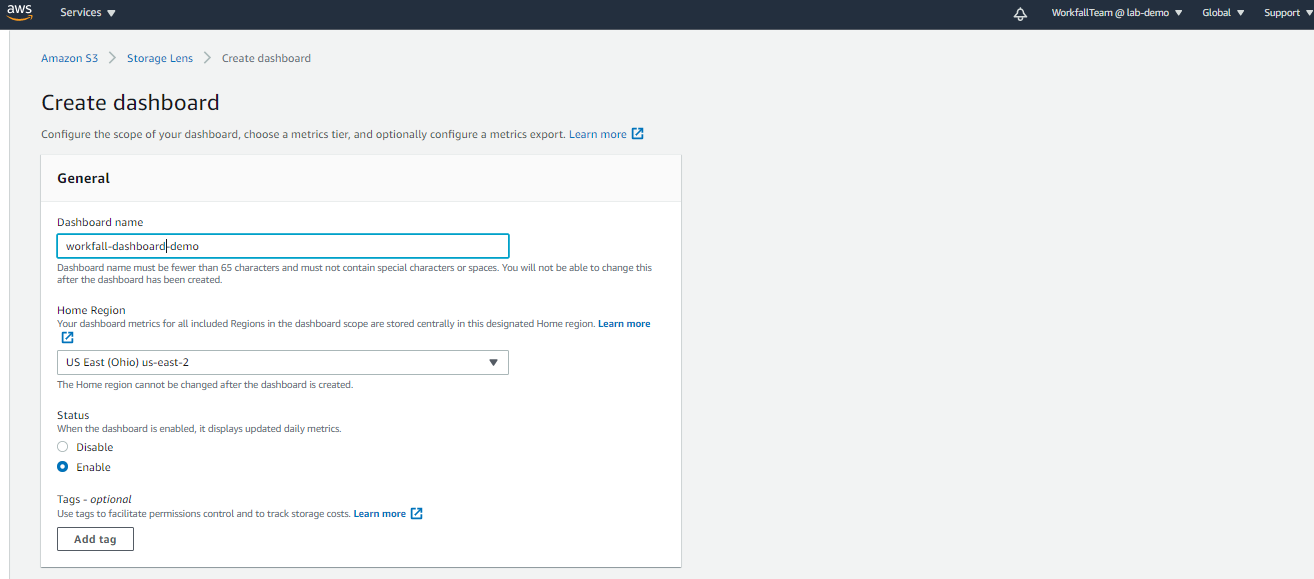
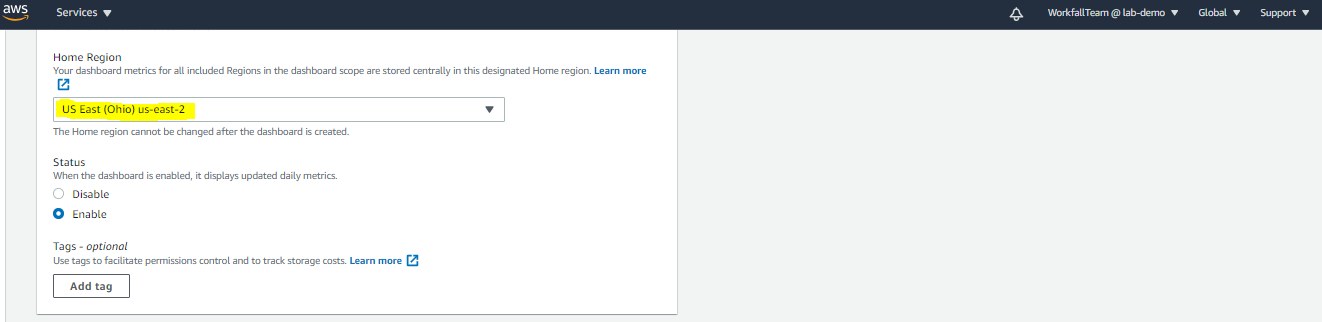
Home region: Home region is the region where all the metrics data of the dashboard including all the regions will be stored.
Currently home region is available in all regions except 4 regions mentioned below:-
- Africa (Cape Town) (af-south-1)
- Asia Pacific (Hong Kong) (ap-east-1)
- Europe (Milan) (eu-south-1)
- Middle East (Bahrain) (me-south-1)
Note: Home region cannot be modified after you have created the dashboard.
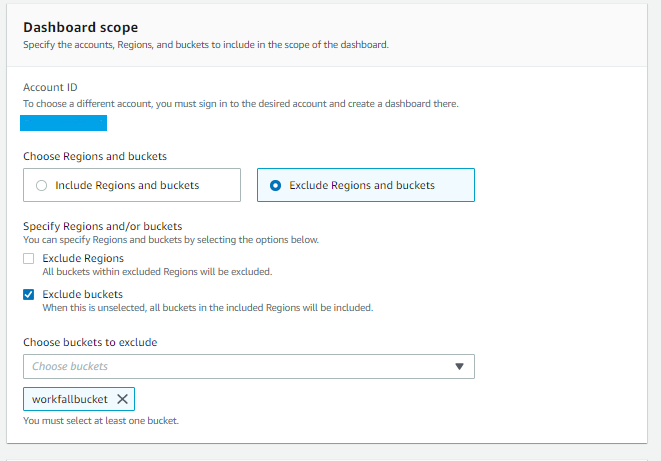
Scroll below, you will see the dashboard scope box. Here, you can include or exclude regions and buckets as per your choice. So, here we can visualize the objects for our bucket workfallbucket-test and exclude another bucket.
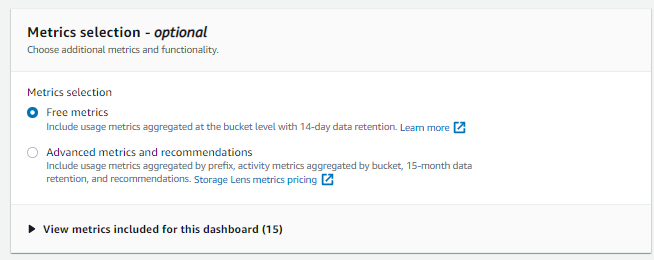
For metric selection, we will select free metrics here for the demo. You can select advanced metrics and recommendations to increase the complexity of storage analysis. Advanced metrics are chargeable.
15 Usage metrics are available with free metrics selection are mentioned below:
- Total storage
- Object count
- Current version bytes
- Current version object count
- Noncurrent version bytes
- Noncurrent version object count
- Delete marker object count
- Encrypted bytes
- Encrypted object count
- Replicated bytes
- Replicated object count
- Object lock bytes
- Object lock object count
- Incomplete MPU bytes
- Incomplete MPU object count
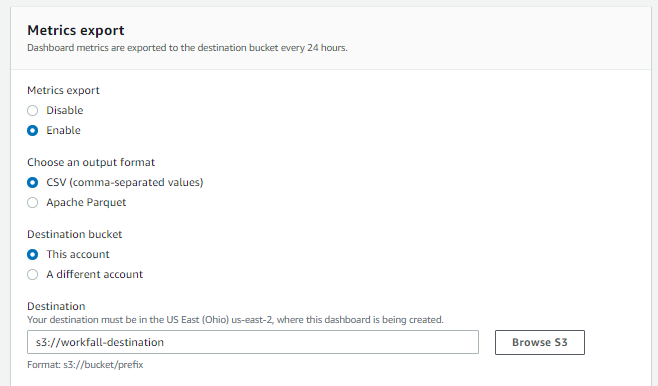
For metrics export, you can enable it to get the metrics data exported every 24 hours to the destination bucket.
Choose the output format as CSV. The destination bucket could be created in your account or a different account. Destination bucket should be in the same region where the dashboard is being created.
Select your destination bucket using the Browse S3 tab.
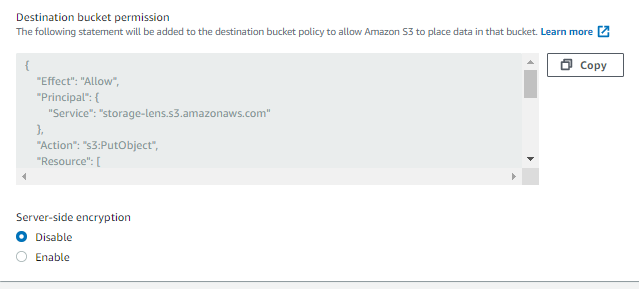
The destination bucket permission policy will be auto-generated. Then click on Create Dashboard.
You will get your dashboard listed in the Dashboards page.
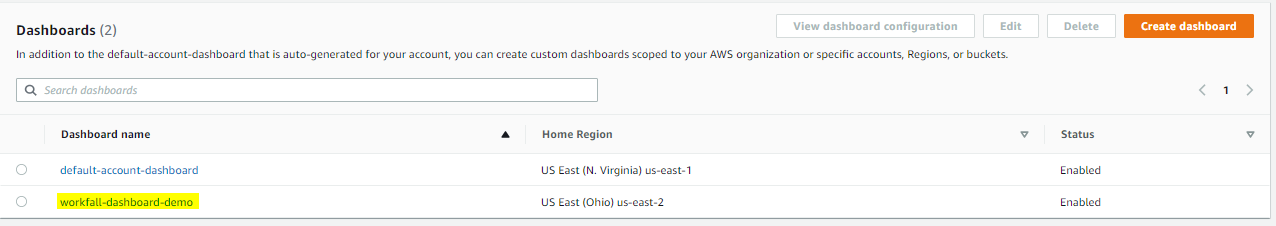
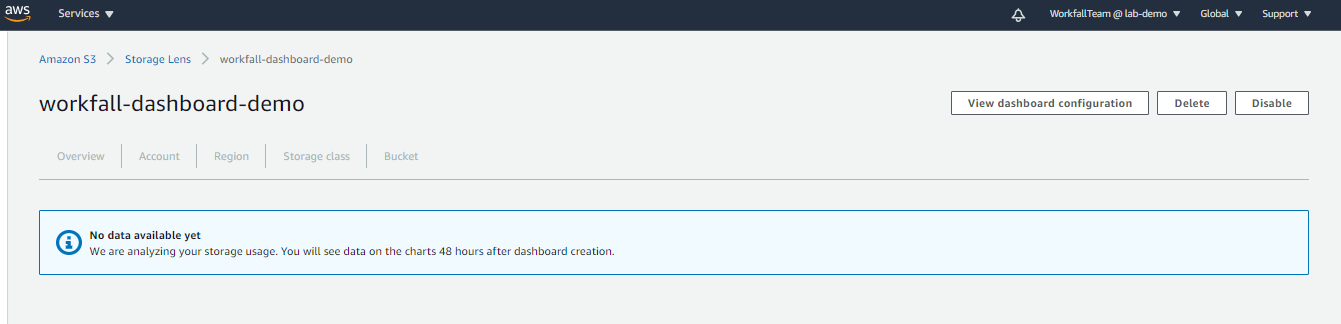
Select your dashboard workfall-dashboard-demo, you will get redirected to your dashboard.
You will be able to view the data after 48 hours of dashboard creation.
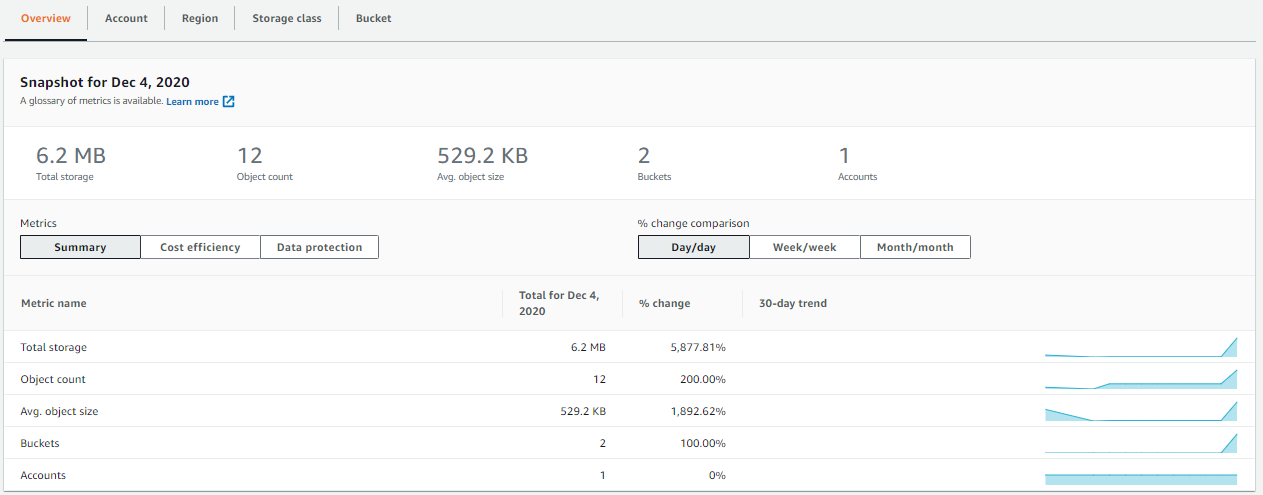
Now, our dashboard is ready and we can view the sights of our data. We can filter the data in the dashboard by Accounts, Regions, Storage Objects, and Buckets.

As you scroll down, you will see the next portion which contains the snapshot. Here, you can get information on various metrics such as Total storage, Object count, Avg. object size, etc. You can also view the 30-day trend of each metric.
The % change comparison column shows Day/day by default. You can change it to Week/week and Month/month to get the % change insights for them as well.
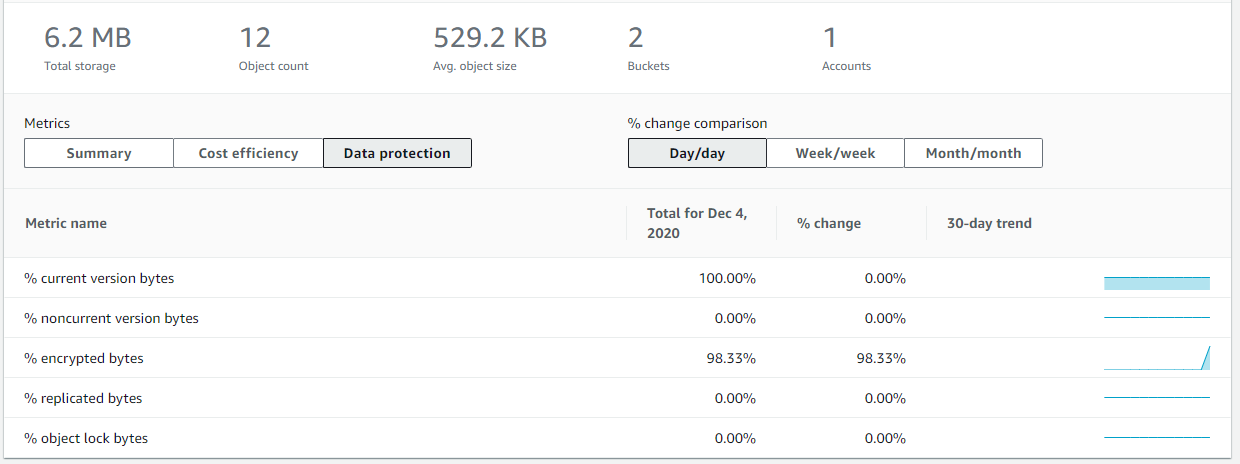
As you select Data Protection from the Metrics section, you will see below metrics data. It is showing the % current version bytes, % noncurrent version bytes, % encrypted bytes, % replicated bytes, and % object lock bytes. Here, you can check if your object bytes are encrypted or if you have set up an object lock for your objects and so on.
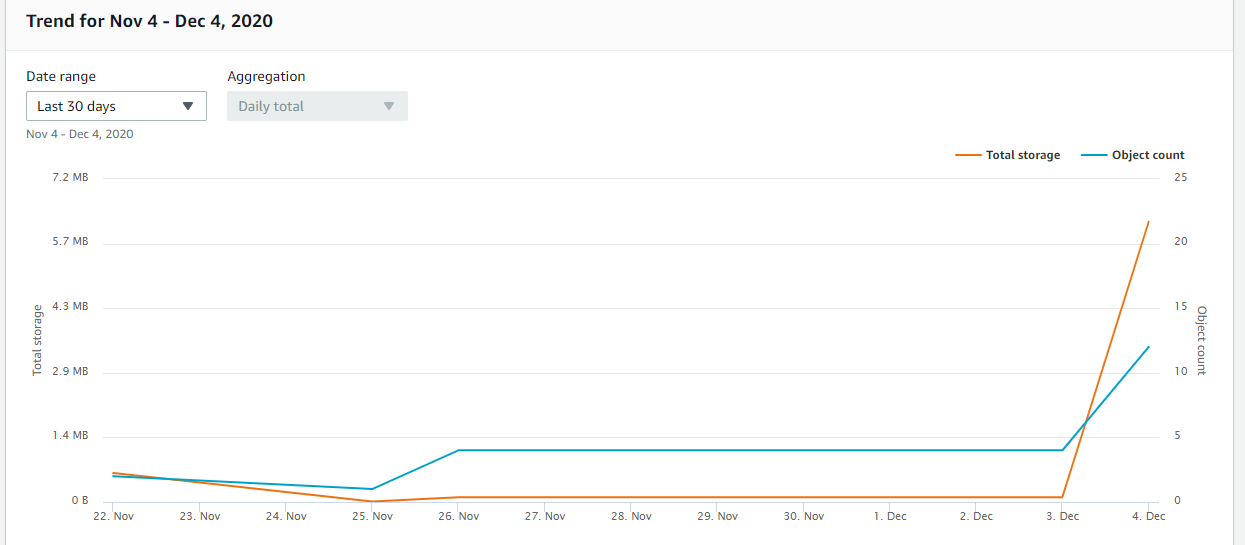
In the next segment, you can see the data trend for 1 month. You can change the data range from the drop-down. In the Trends and Distribution section, you can select the primary and secondary metrics to get the visuals as shown below.

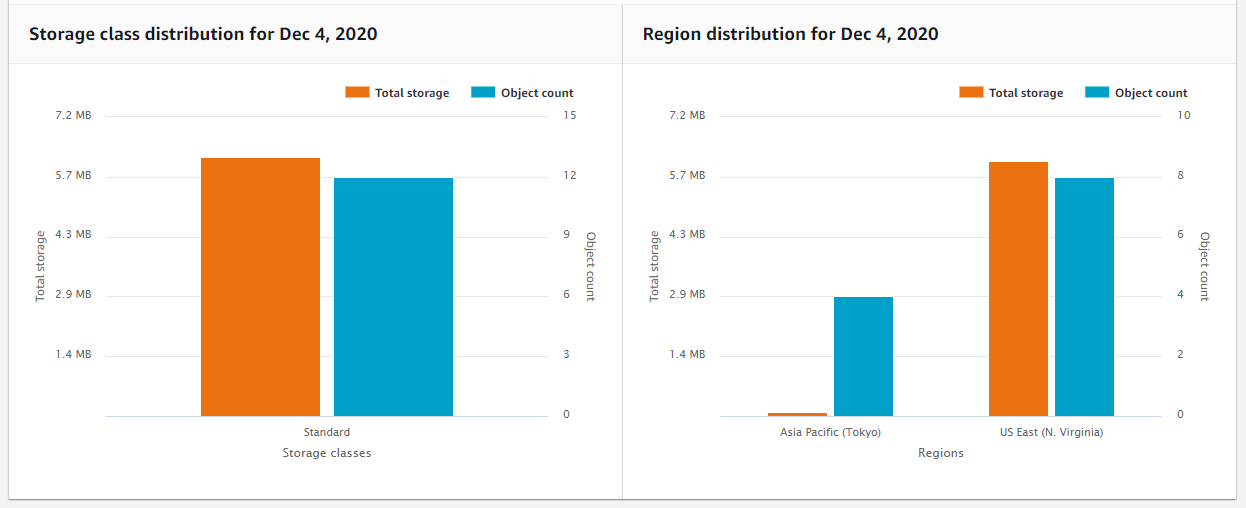
In the next section, you can see the Storage class distribution and Region distribution.
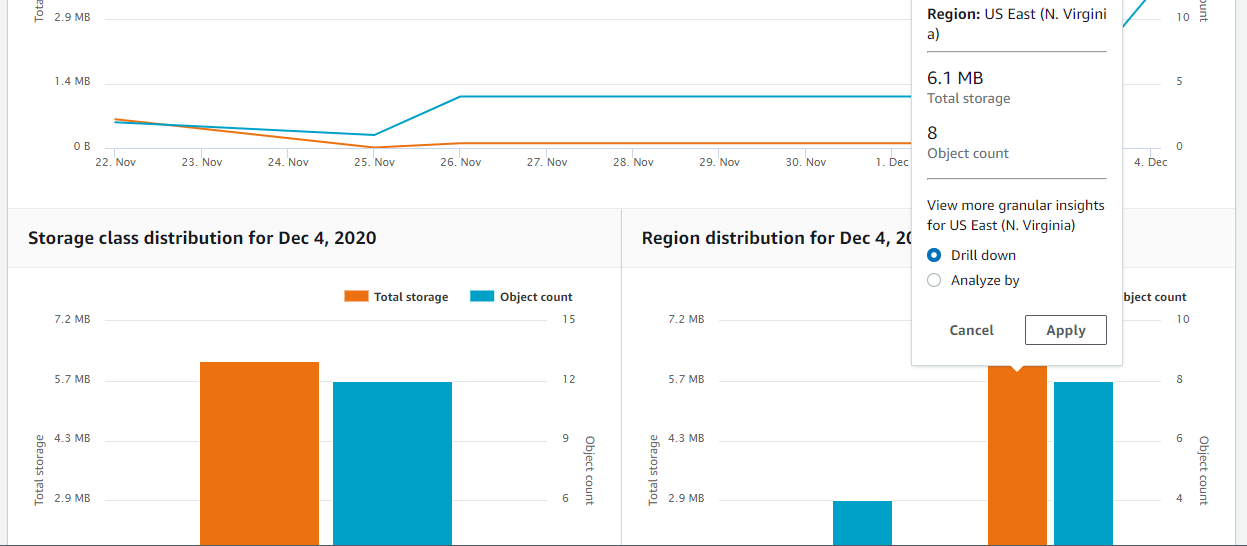
You can click on any value in this graph to get more granular information.
Next section contains the Top N overview. Top N should be a whole number between 3 to 25. You can select the metric and Date range from drop down. Sort ascending or descending as per your choice.
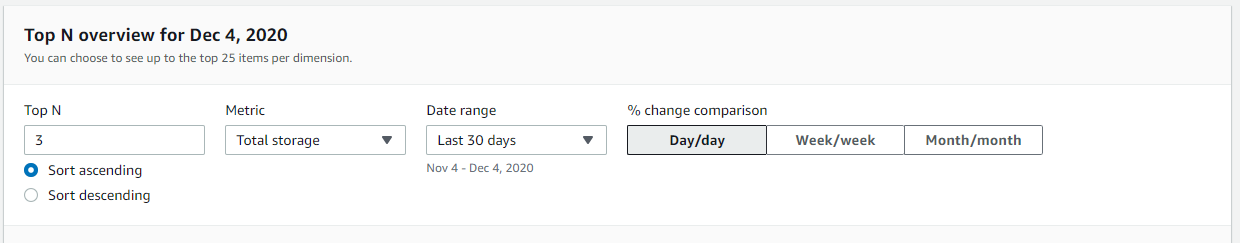
This section will show the Top 3 accounts, Top 3 regions and Top 3 buckets because we have chosen the value of N as 3.

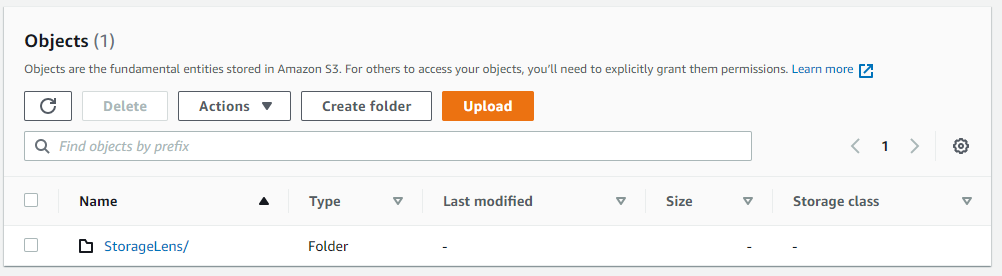
Every 24 hours, the data will be exported to the destination bucket. As you can see below, a folder has been created with the name StorageLens.

Two folders are created inside the above folder. The first folder named manifests contains the manifest.json file and another one reports contain the CSV file. Once your dashboard is enabled, you will get the daily reports in the destination bucket. If the dashboard is disabled, no reports will be recorded by S3 Storage Lens and only the history data will be retained for 14 days.

So, this is how you can drill your data in S3 using S3 Storage Lens to get the most out of it and you can ensure that your data is protected, and the buckets are cost-effectively maintained.
S3 Storage Lens is really such a great tool for visualizing Terabytes of storage within seconds.
Hope this information is helpful. We will keep sharing more about how to use new AWS services. Stay tuned!
Meanwhile …
Keep Exploring -> Keep Learning -> Keep Mastering
This blog is part of our effort toward building a knowledgeable and kick-ass tech community. At Workfall, we strive to provide the best tech and pay opportunities to AWS-certified talents. If you’re looking to work with global clients, and build kick-ass products while making big bucks doing so, give it a shot at workfall.com/partner today.