Whether you’re considering a cloud migration or have already made the switch to AWS, you’ll want to know how to manage your digital environment. With Amazon CloudWatch, AWS makes monitoring simple. CloudWatch is the cornerstone of your AWS infrastructure management. It has a robust framework for capturing and storing metrics and logs.
While the management tools for viewing and analysis are basic, you can quickly develop a full monitoring and management platform for your infrastructure by combining CloudWatch with third-party solutions. Refer to part 2 of the blog here.
In this blog we will cover :
- What is Amazon CloudWatch?
- Amazon CloudWatch Composition
- What are Amazon CloudWatch Logs?
- What is Amazon CloudWatch Synthetics?
- How does Amazon CloudWatch work?
- Benefits of using Amazon CloudWatch
- Use Cases
- Features of Amazon CloudWatch
- AWS Resources monitored by Amazon CloudWatch
- Amazon CloudWatch Pricing
- Customers using Amazon CloudWatch
- Conclusion
What is Amazon CloudWatch?
Amazon CloudWatch is a monitoring and observability service geared toward DevOps engineers, developers, SREs, and IT managers. To monitor your applications, respond to system-wide performance changes, optimize resource use, and receive a single view of operational health, CloudWatch provides data and actionable insights. CloudWatch gathers monitoring and operational data in the form of logs, metrics, and events, giving you a unified view of AWS resources, applications, and services running on both AWS and on-premises servers. CloudWatch may be used to detect unusual behavior in your environments, trigger alarms, and compare logs and data.
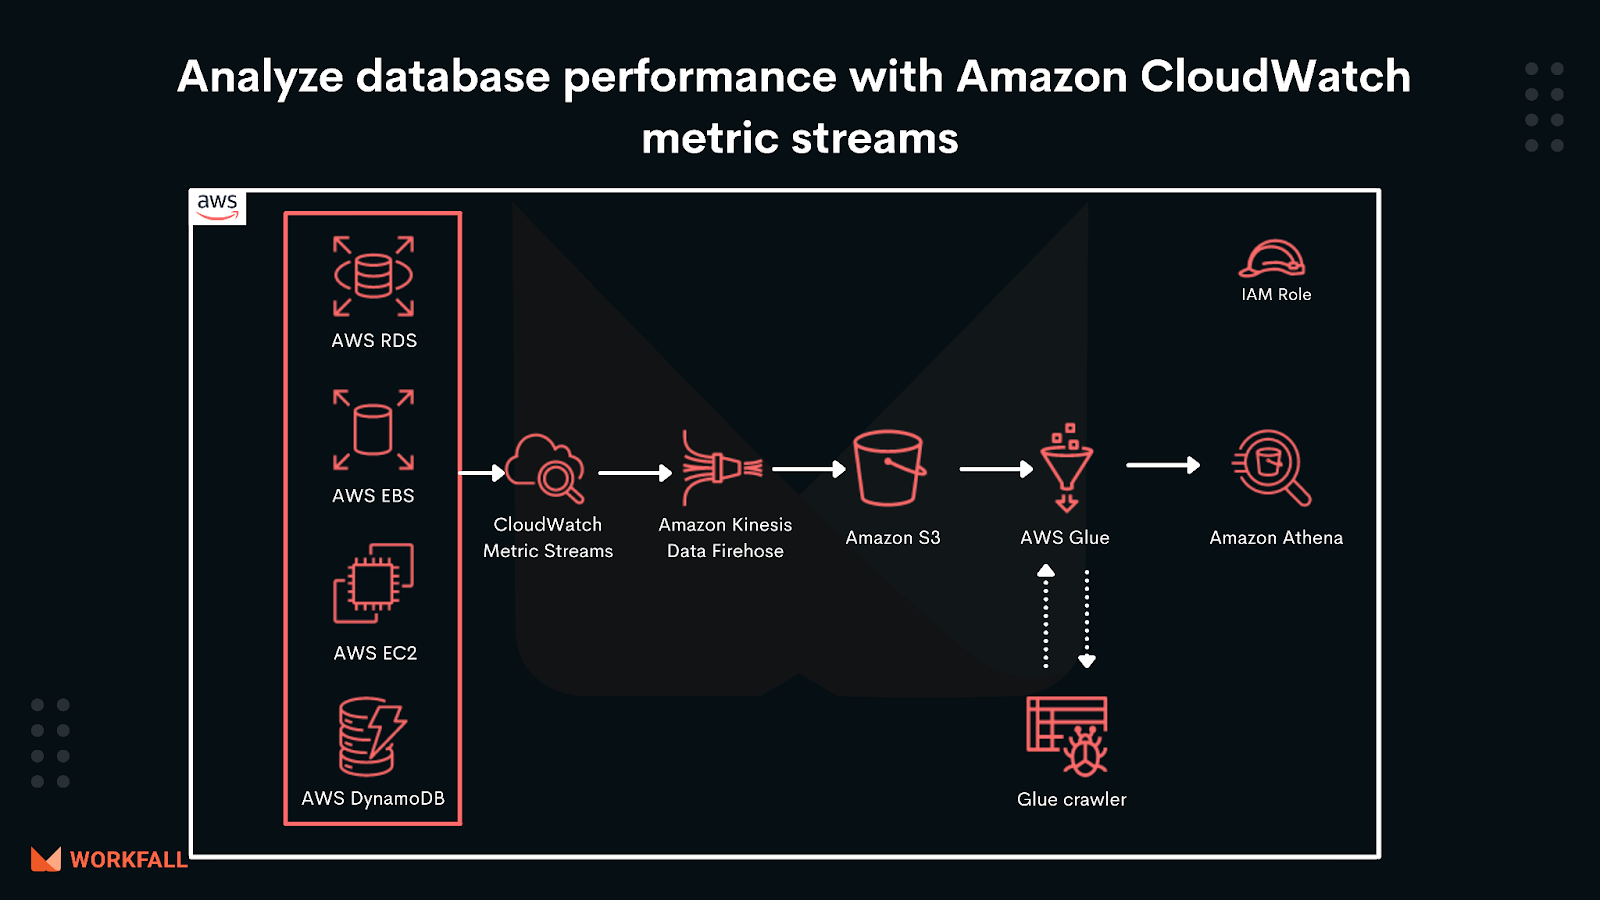
One can stream near-real-time metrics data to a destination such as Amazon Simple Storage Service (Amazon S3). Metric Streams support two primary use cases: Third-party providers and data lakes.
Amazon CloudWatch Composition
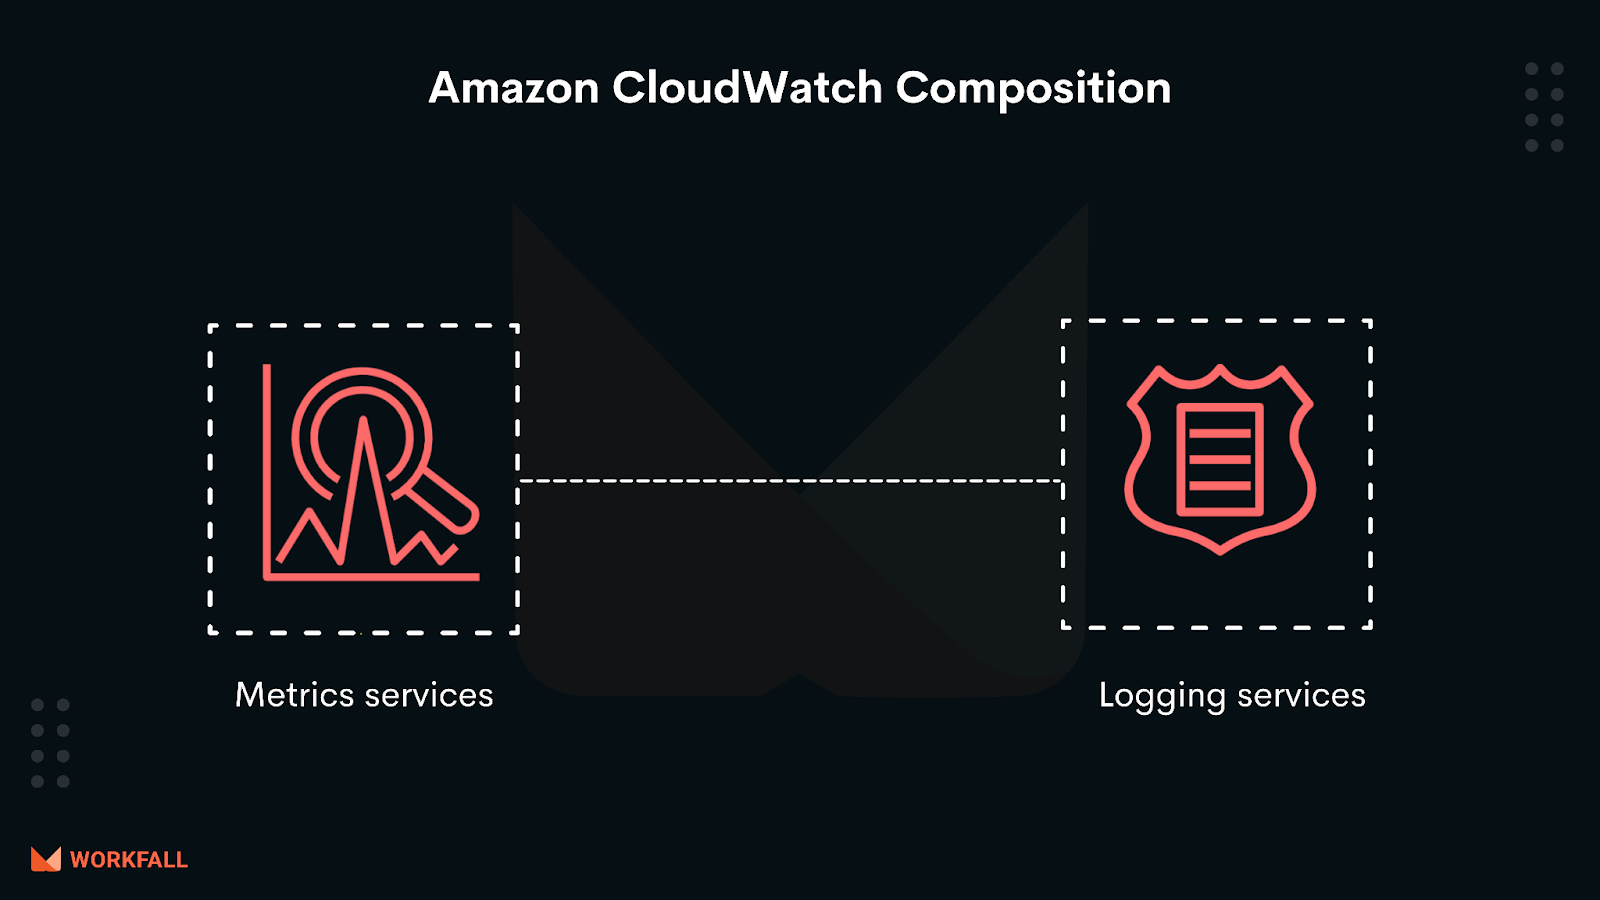
CloudWatch is composed of two distinct services:
A service that tracks and manages resource performance and operational parameters: The Metrics service captures, stores, and displays resource metric data via dashboards, event filtering, and alerts. CloudWatch Events is the name of the event service, and CloudWatch Alarms is the name of the alarm service.
A logging service that collects, stores, and manages logs from services and applications: CloudWatch Logs is a logging service that includes log data capture, storage, archiving, and CloudWatch Logs Insights, a basic log viewer and query capability.
What are Amazon CloudWatch Logs?

Amazon CloudWatch Logs lets you monitor and troubleshoot your systems and applications using your existing system, application, and custom log files.
With CloudWatch Logs, you can monitor your logs, in near real-time, for specific phrases, values, or patterns. You can use CloudWatch Logs in a number of ways.
Real-time application and system monitoring: CloudWatch Logs can be used to leverage log data to monitor applications and systems. CloudWatch Logs, for example, may keep track of the number of mistakes in your application logs and notify you when the rate of errors exceeds a threshold you choose. CloudWatch Logs monitors your log data, so no changes to your code are required.
Long-term log retention: You can use CloudWatch Logs to store your log data indefinitely in highly durable and cost-effective storage without worrying about hard drives running out of space. The CloudWatch Logs Agent makes it easy to quickly move both rotated and unrotated log files off of a host and into the log service. You can then access the raw log event data when you need it.
What is Amazon CloudWatch Synthetics?
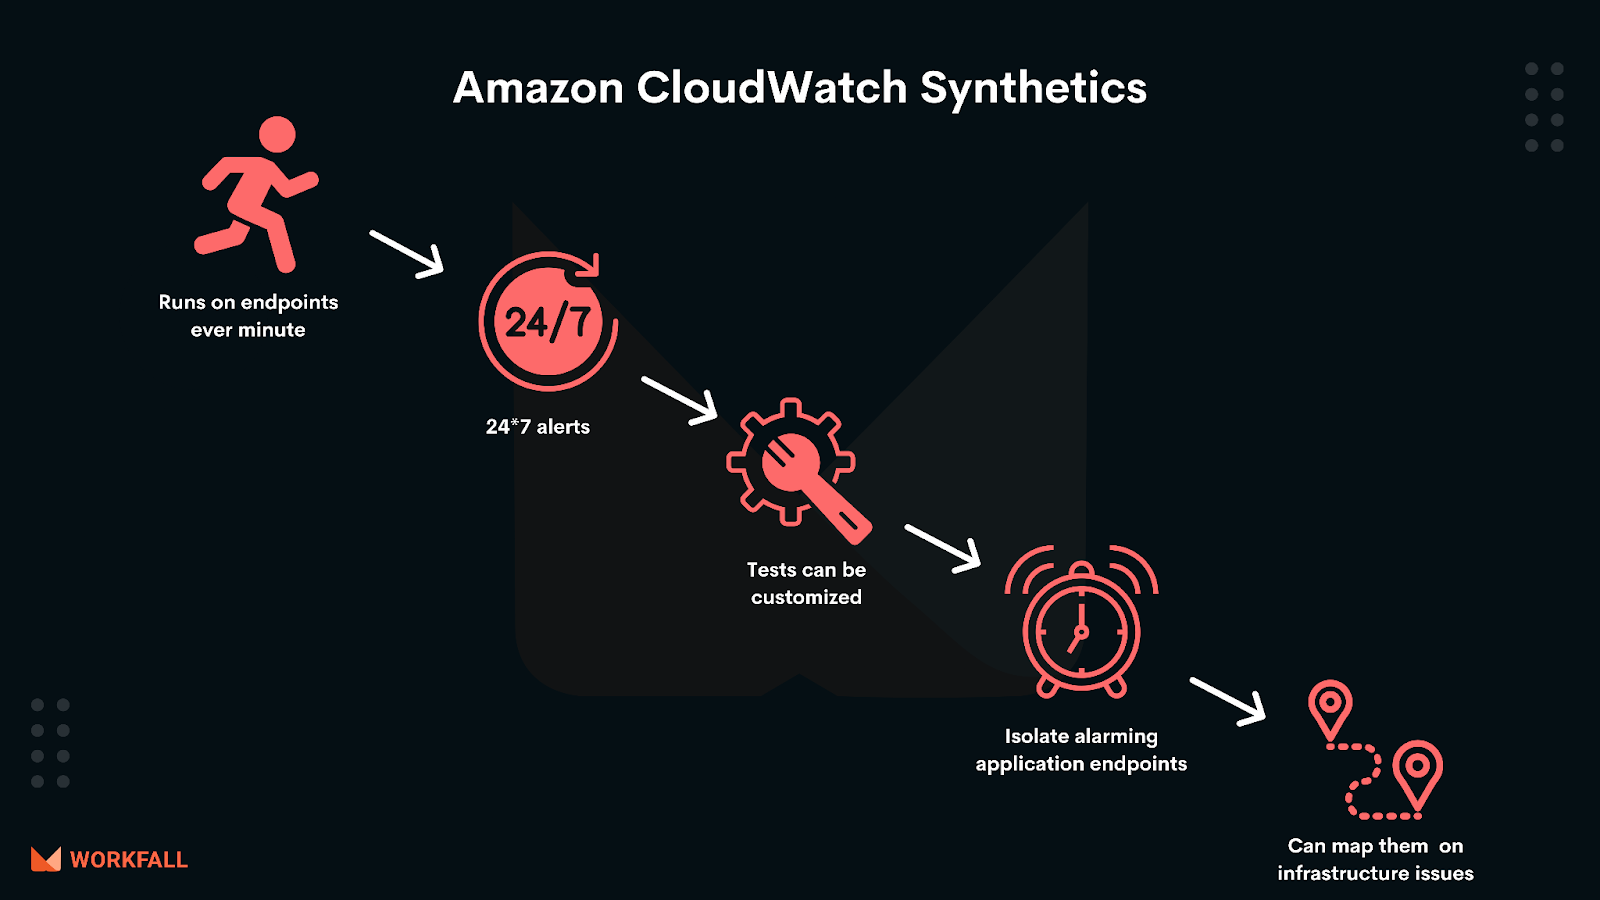
Amazon CloudWatch Synthetics makes it easier to keep track of application endpoints. It conducts checks on your endpoints every minute, 24 hours a day, seven days a week, and notifies you if they don’t behave as intended. These tests can be tailored to check for things like availability, latency, transactions, broken or dead links, step-by-step task completions, page load issues, UI asset load latencies, complex wizard flows, and checkout processes in your apps. To shorten the mean time to resolution, you can utilize CloudWatch Synthetics to isolate alarming application endpoints and link them back to underlying infrastructure issues.
How does Amazon CloudWatch work?
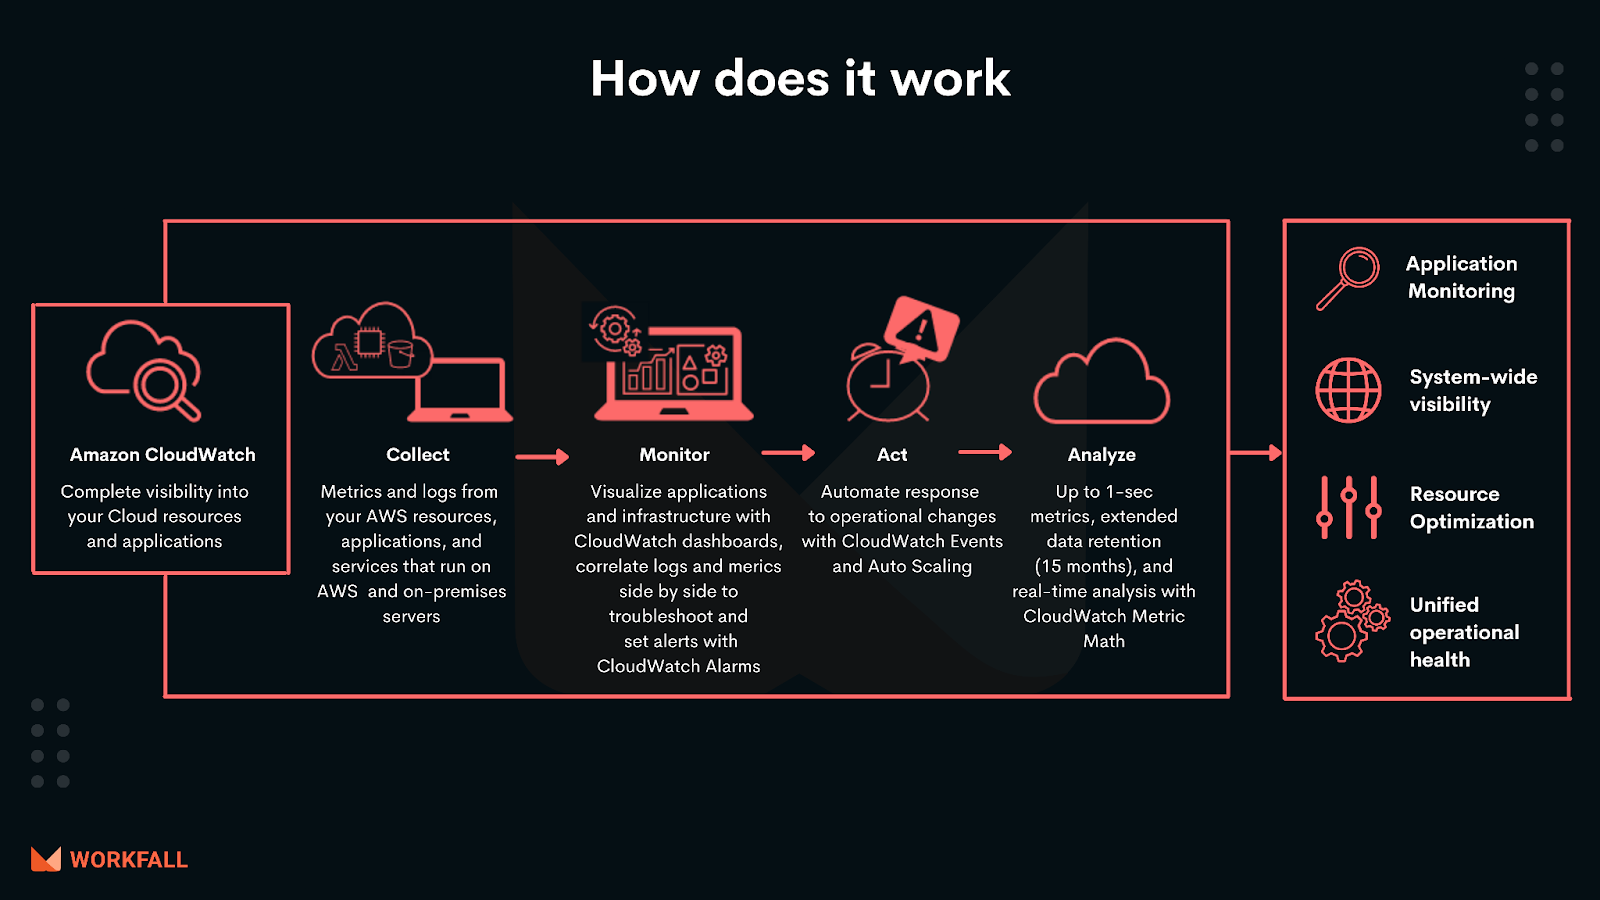
CloudWatch collects monitoring and operational data in the form of logs, metrics, and events, and visualizes it using automated dashboards to provide you with a single view of your AWS resources, applications, and services that run on-premises and in the cloud. You can correlate your metrics and logs to gain a better understanding of your resources’ health and performance. You can also set alarms based on metric value thresholds you designate or use machine learning methods to look for unusual metric behavior.
Benefits of using Amazon CloudWatch
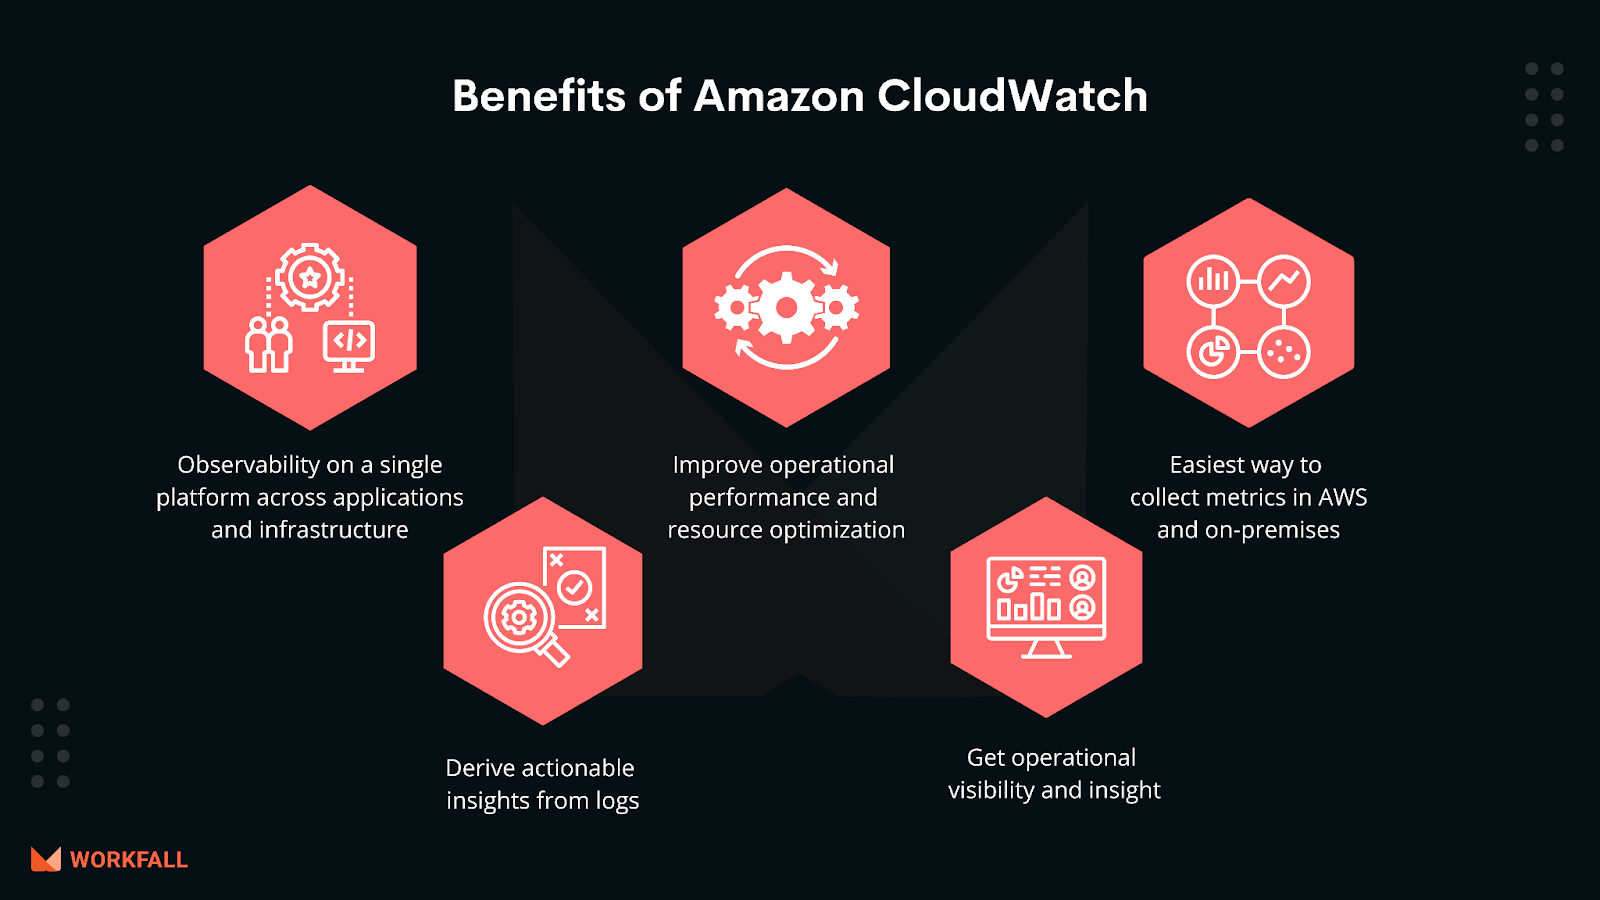
Reliable Delivery of CloudWatch Metrics: Because this streaming solution does not use your CloudWatch API quota, there is no risk of data loss due to API throttling events.
Automatic retry Capabilities: For providing metrics to Sumo Logic, Kinesis Data Firehose has an automatic retry method. If the service is restored after a failure, the metrics are re-sent, and if that fails, Kinesis Firehose archives all unsuccessful messages in a customer-owned S3 bucket for subsequent recovery.
Low Latency: Sumo Logic receives CloudWatch metrics as soon as they are made accessible by the CloudWatch service. Due to the low frequency of polling, polling-based metrics-gathering techniques can suffer from increased latencies.
Efficient Filtering: Sumo Logic source enriches incoming metrics with AWS tags, which may be configured as tag filters to further refine metrics ingestion. CloudWatch Metric Streams allows customers to set up namespace filters prior to delivery to Sumo Logic.
Use Cases of Amazon CloudWatch
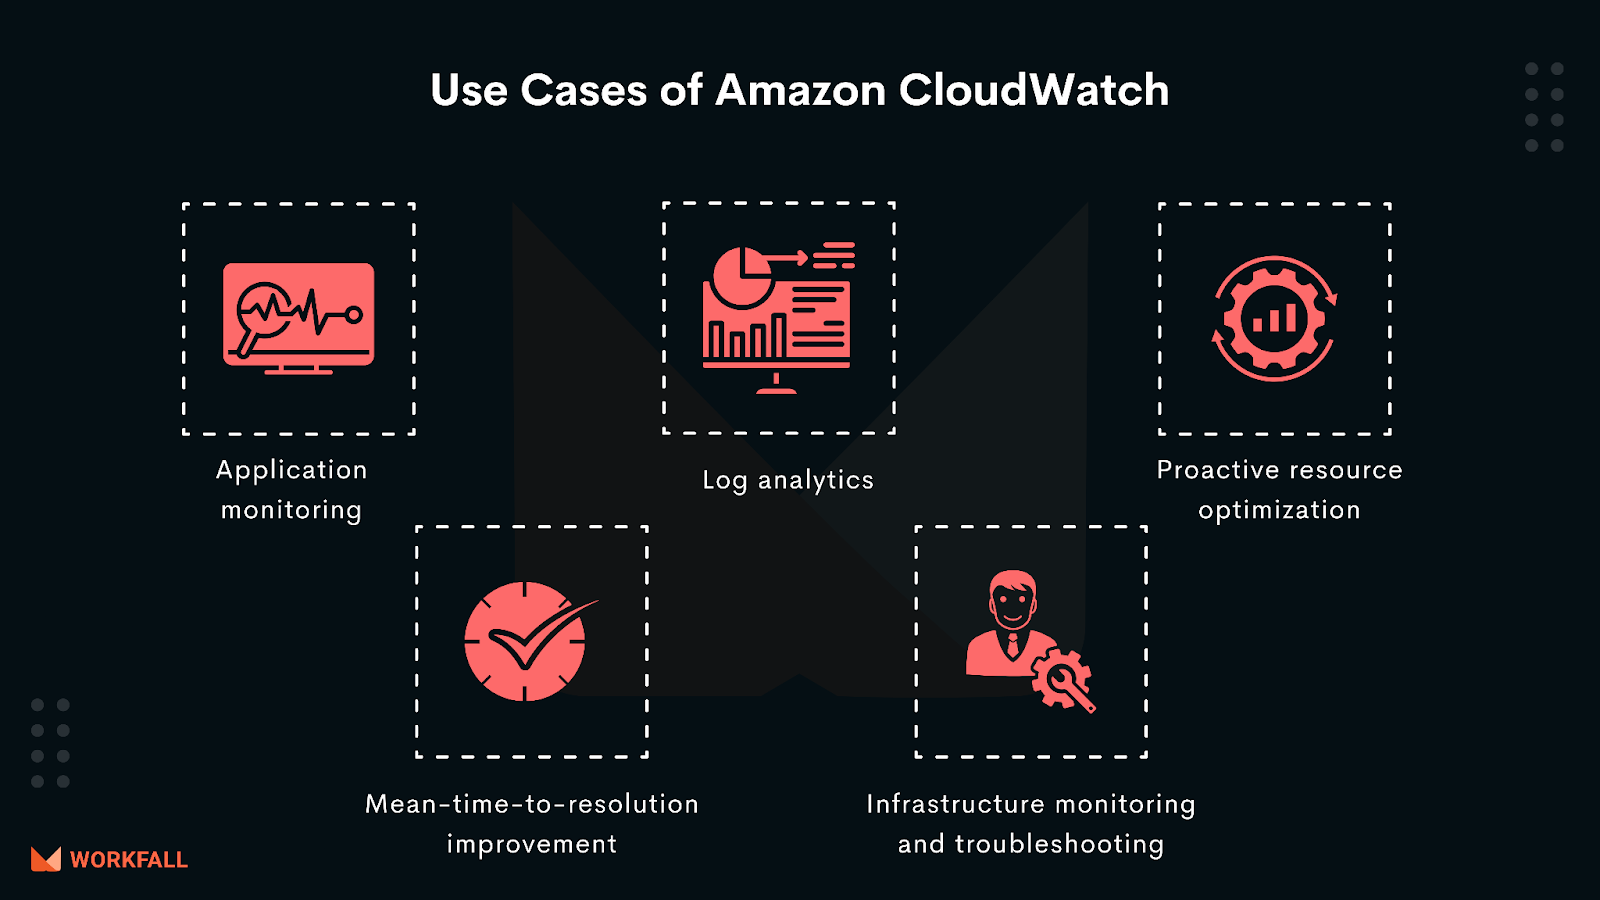
Log analytics: Exploring, analyzing, and visualizing your logs can help you solve operational problems and improve the performance of your applications. You can use inquiries to help you respond to operational concerns more quickly and efficiently. If an issue arises, you can immediately begin querying with a purpose-built query language to quickly identify possible causes.
Infrastructure Monitoring and troubleshooting: To discover and resolve the root cause of performance issues in your AWS resources, monitor key metrics and logs, visualize your application and infrastructure stack, trigger alarms, and correlate metrics and logs. Monitoring your container ecosystem across Amazon ECS, AWS Fargate, Amazon EKS, and Kubernetes is part of this.
Proactive resource optimization: CloudWatch alerts keep an eye on your metric values against thresholds that you set or that CloudWatch creates for you using machine learning models to detect unusual behavior. If an alarm is raised, CloudWatch can immediately take action, such as enabling Amazon EC2 Auto Scaling or stopping an instance, to automate capacity and resource planning.
Application monitoring: Monitor your AWS (Amazon EC2, containers, and serverless) and on-premises apps. CloudWatch collects data from all layers of the performance stack, including metrics and logs, and displays it in automatic dashboards.
Mean-time-to-resolution improvement: CloudWatch enables you to correlate, visualize, and analyze metrics and logs so you can respond fast to issues. You can also combine these with trace data from AWS X-Ray for end-to-end observability. You can also leverage user requests to aid with troubleshooting and debugging, as well as to reduce overall mean-time-to-resolution (MTTR).
Features of Amazon CloudWatch
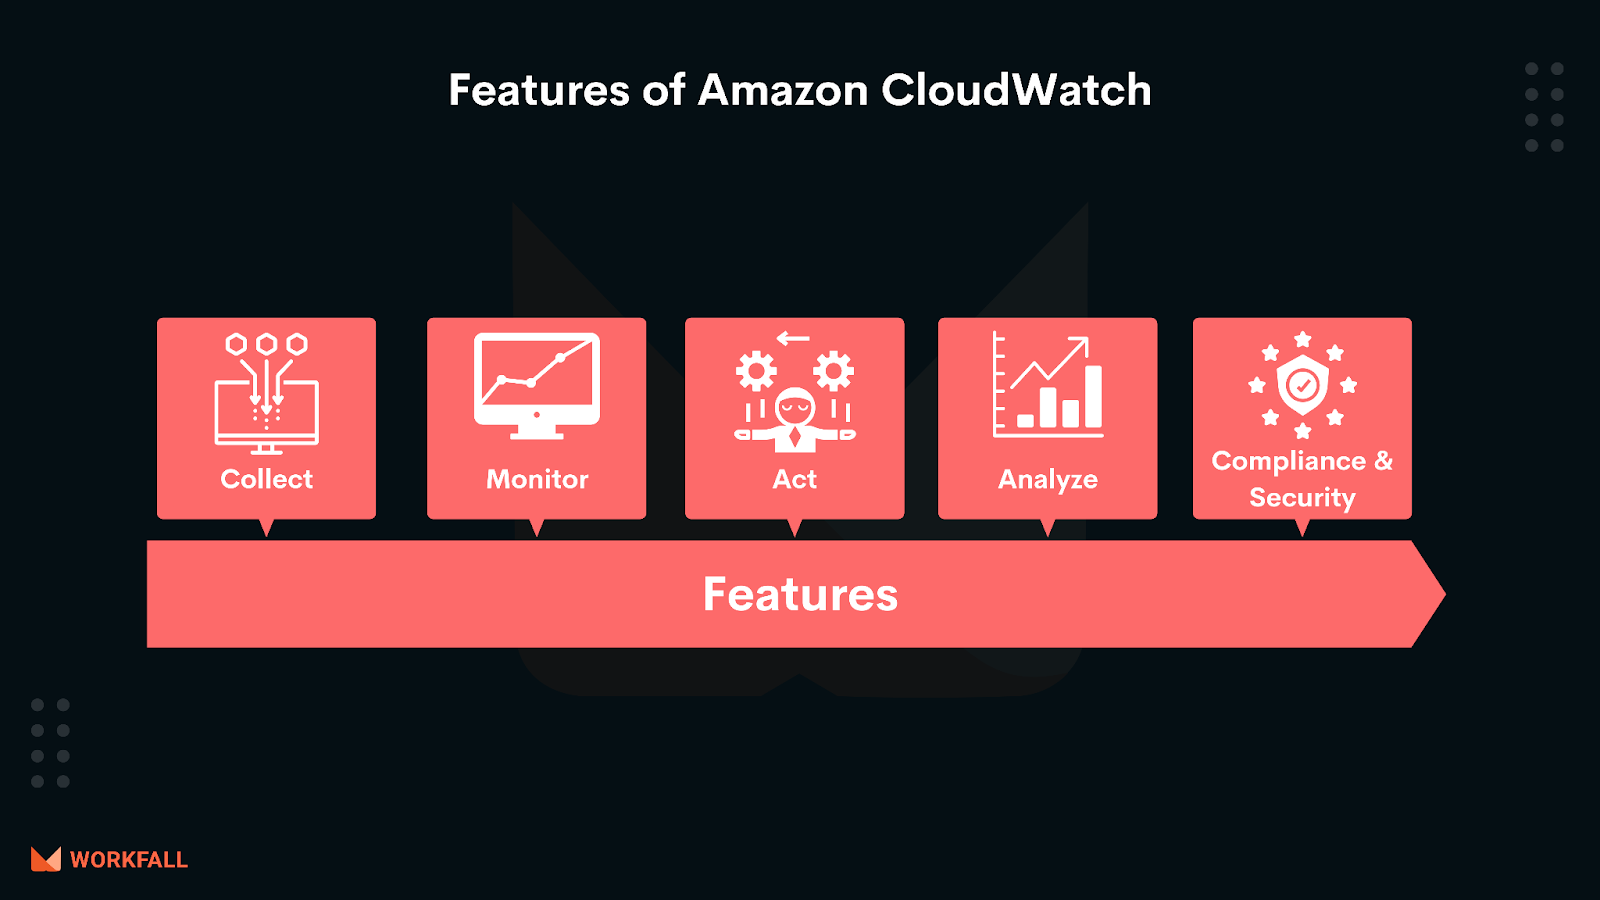
Collect: You may use Amazon CloudWatch to collect custom metrics from your own apps to track operational performance, solve problems, and discover patterns. A custom measure like user activity is one that you can gather and track over time. To publish these metrics to CloudWatch, you can use the CloudWatch Agent or the PutMetricData API operation. For your own unique metrics data, all CloudWatch capabilities, including statistics, graphs, and alarms, will be available at up to one-second intervals.
Observe: You may compare critical indicators like CPU use and RAM to capacity by visualizing them. You can also correlate a certain metric’s log pattern and set alarms to be notified proactively about performance and operational difficulties. This gives you a system-wide view of operational health and the ability to troubleshoot issues rapidly, minimizing Mean Time to Resolution (MTTR).
Security and Compliance: You can regulate which people and resources have permission to access your data and how they can access it using Amazon CloudWatch and AWS Identity and Access Management (IAM).
Amazon CloudWatch Logs is also compliant with PCI and FedRamp. Data is encrypted both in transit and at rest. You can also encrypt your log groups using AWS KMS encryption for added compliance and security.
Analyze: Amazon CloudWatch Metric Math allows you to do calculations across numerous metrics in real-time, allowing you to quickly gain insights from your existing CloudWatch metrics and gain a better understanding of your infrastructure’s operational health and performance. These computed metrics can be shown in the AWS Management Console, added to CloudWatch dashboards, or retrieved with the GetMetricData API operation. Metric Math includes arithmetic operators like +, -, /, and *, as well as mathematical functions like Sum, Average, Min, Max, and Standard Deviation.
Act: CloudWatch Events gives you access to a near-real-time stream of system events that describe changes to your AWS resources. It enables you to react swiftly to operational changes and make necessary adjustments. Simply construct rules to specify which events are relevant to your application and what automated actions should be taken when a rule matches an event. Set a rule to call AWS Lambda functions or inform an Amazon Simple Notification Service (SNS) subject, for example.
AWS resources monitored by Amazon CloudWatch

Amazon CloudWatch can monitor various AWS services:
- EC2 Instance
- AutoScaling
- Load Balancer
- Amazon SNS
- Amazon SQS
- Amazon RDS
- Amazon S3
- DynamoDB
Amazon CloudWatch Pricing

You can use Amazon CloudWatch for free to get started. Most AWS services (EC2, S3, Kinesis, and so on) submit metrics to CloudWatch automatically and for free. Many applications should be able to work within the free tier restrictions.
There is no up-front commitment or minimum fee. You simply pay for what you use and will be charged at the end of the month for your usage.
Customers using Amazon CloudWatch
Mapbox
Mapbox is an open-source mapping platform for custom-designed maps that reaches more than 300 million people each month. Mapbox uses Amazon CloudWatch for ingestion of multiple data sources—including native AWS metrics, custom metrics, and logs—as well as monitoring and visualization of key workloads and resource optimization.
- Emily McAfee, Platform Engineering Manager – Mapbox
SendGrid
SendGrid is a provider of cloud email and sends more than 40 billion emails each month for more than 69,000 paying customers. SendGrid adopted Amazon CloudWatch early in its migration to AWS in order to gain system visibility, operational insights, and resource optimization.
- Joshua Barratt, Architect II – SendGrid
CloudPassage
CloudPassage provides comprehensive security, visibility, and continuous compliance for public cloud infrastructure. The company’s Halo platform uses a comprehensive set of security and compliance features to ensure the critical business assets of more than 100 customers—from the Fortune 50 to high-growth startups—are protected.
- Vitaliy Geraymovych, Co-founder & Vice President, Engineering – CloudPassage
Panasonic
Panasonic Avionics Corporation designs, engineers, sells, and installs customized in-flight entertainment and communications solutions for airlines globally. Using Amazon CloudWatch, Panasonic Avionics has found an easy way to collect metrics in AWS and on-premises.
- Anand Desikan, Director of Cloud and Data Services – Panasonic Avionics
Conclusion
In this blog, we have discussed Amazon CloudWatch and its benefits, features, use cases, pricing, customers, and how it works. Throughout your whole AWS infrastructure, you can utilize Amazon CloudWatch to monitor and manage your platform. We will demonstrate the full implementation of how to trigger the lambda function using CloudWatch events with step-by-step instructions in our upcoming blog. Stay tuned to keep getting all updates about our upcoming new blogs on AWS and relevant technologies.
Meanwhile …
Keep Exploring -> Keep Learning -> Keep Mastering
This blog is part of our effort towards building a knowledgeable and kick-ass tech community. At Workfall, we strive to provide the best tech and pay opportunities to AWS-certified talents. If you’re looking to work with global clients, build kick-ass products while making big bucks doing so, give it a shot at workfall.com/partner today.